Troubleshooting
Debugging a Terraform apply is no different than debugging any other component. Workflow logs are displayed upon selecting the component, allowing you to:
- see what was commands were ran and their output
- the Output Values of the modules
Environment details
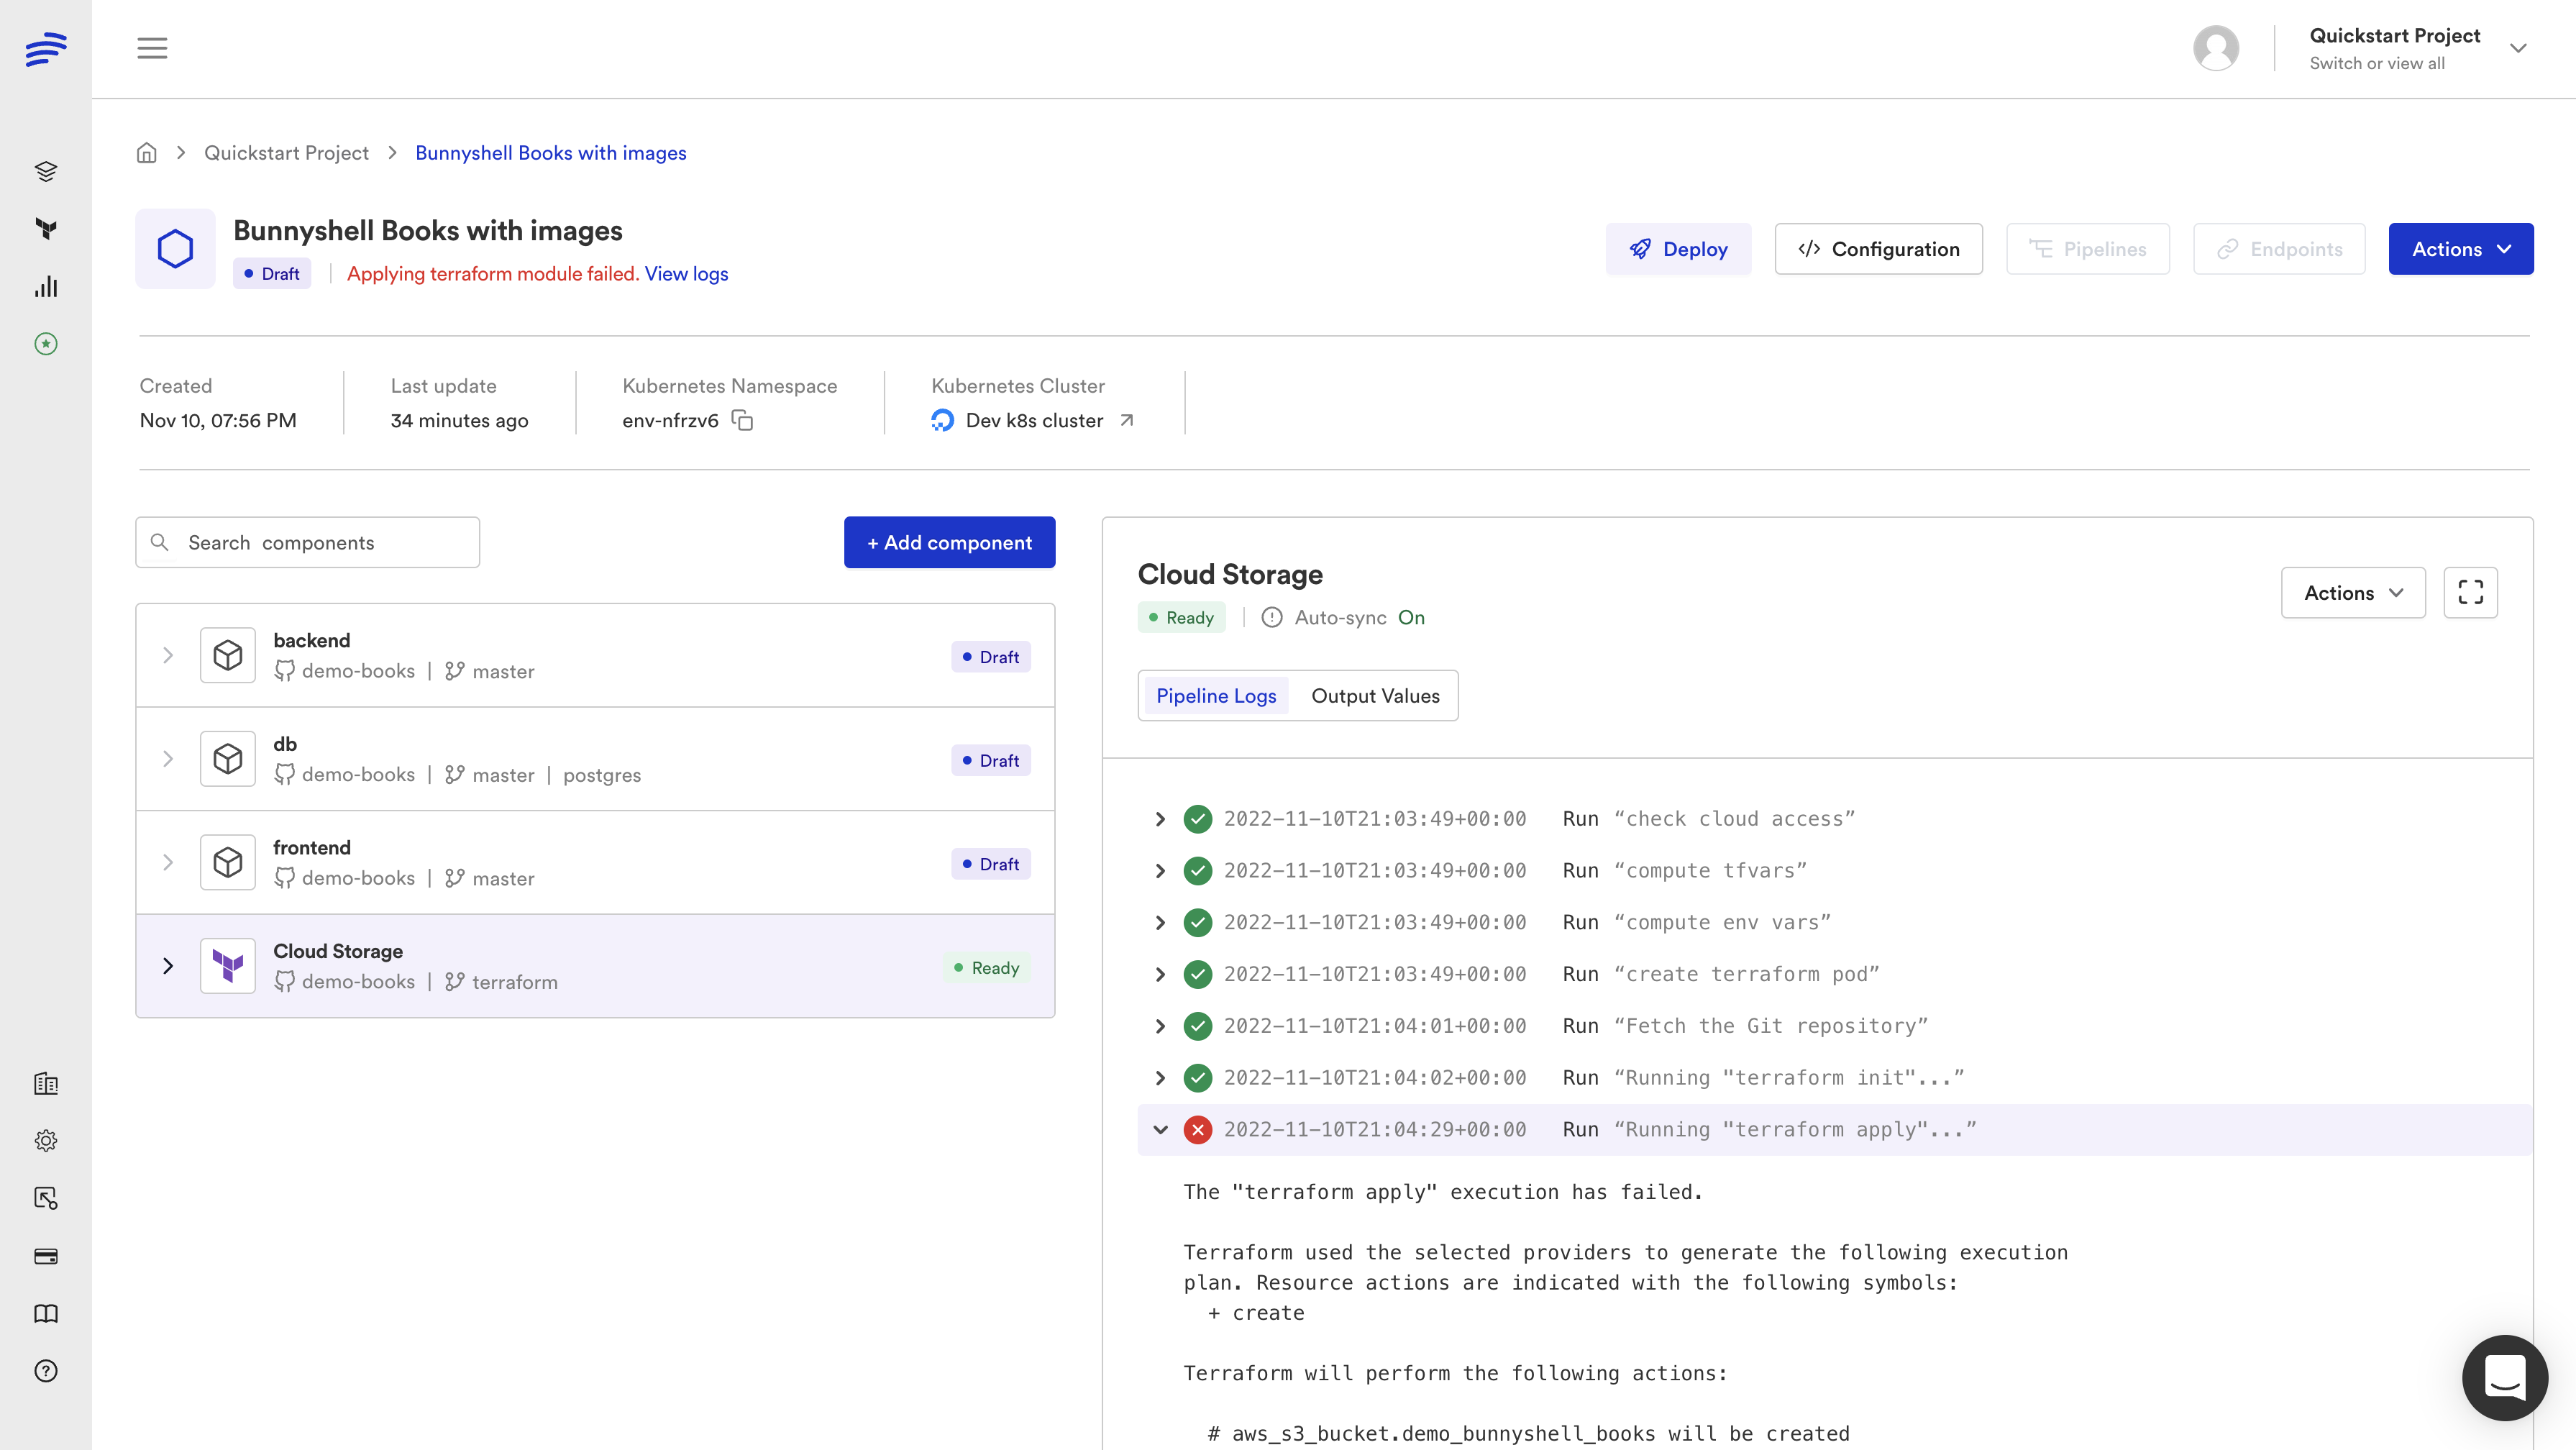
You will be able to see what happened during the Terraform apply process in the Component pipeline view.
Let's take an example to to lack of permissions, which can happen to the best of us :).
In this case, the Terraform Module Component isReady, meaning it is ready to be applied, not finished. After applying, the status will change toApplied.
You can easily see the failed step in the Pipeline logs, as it's marked with red.
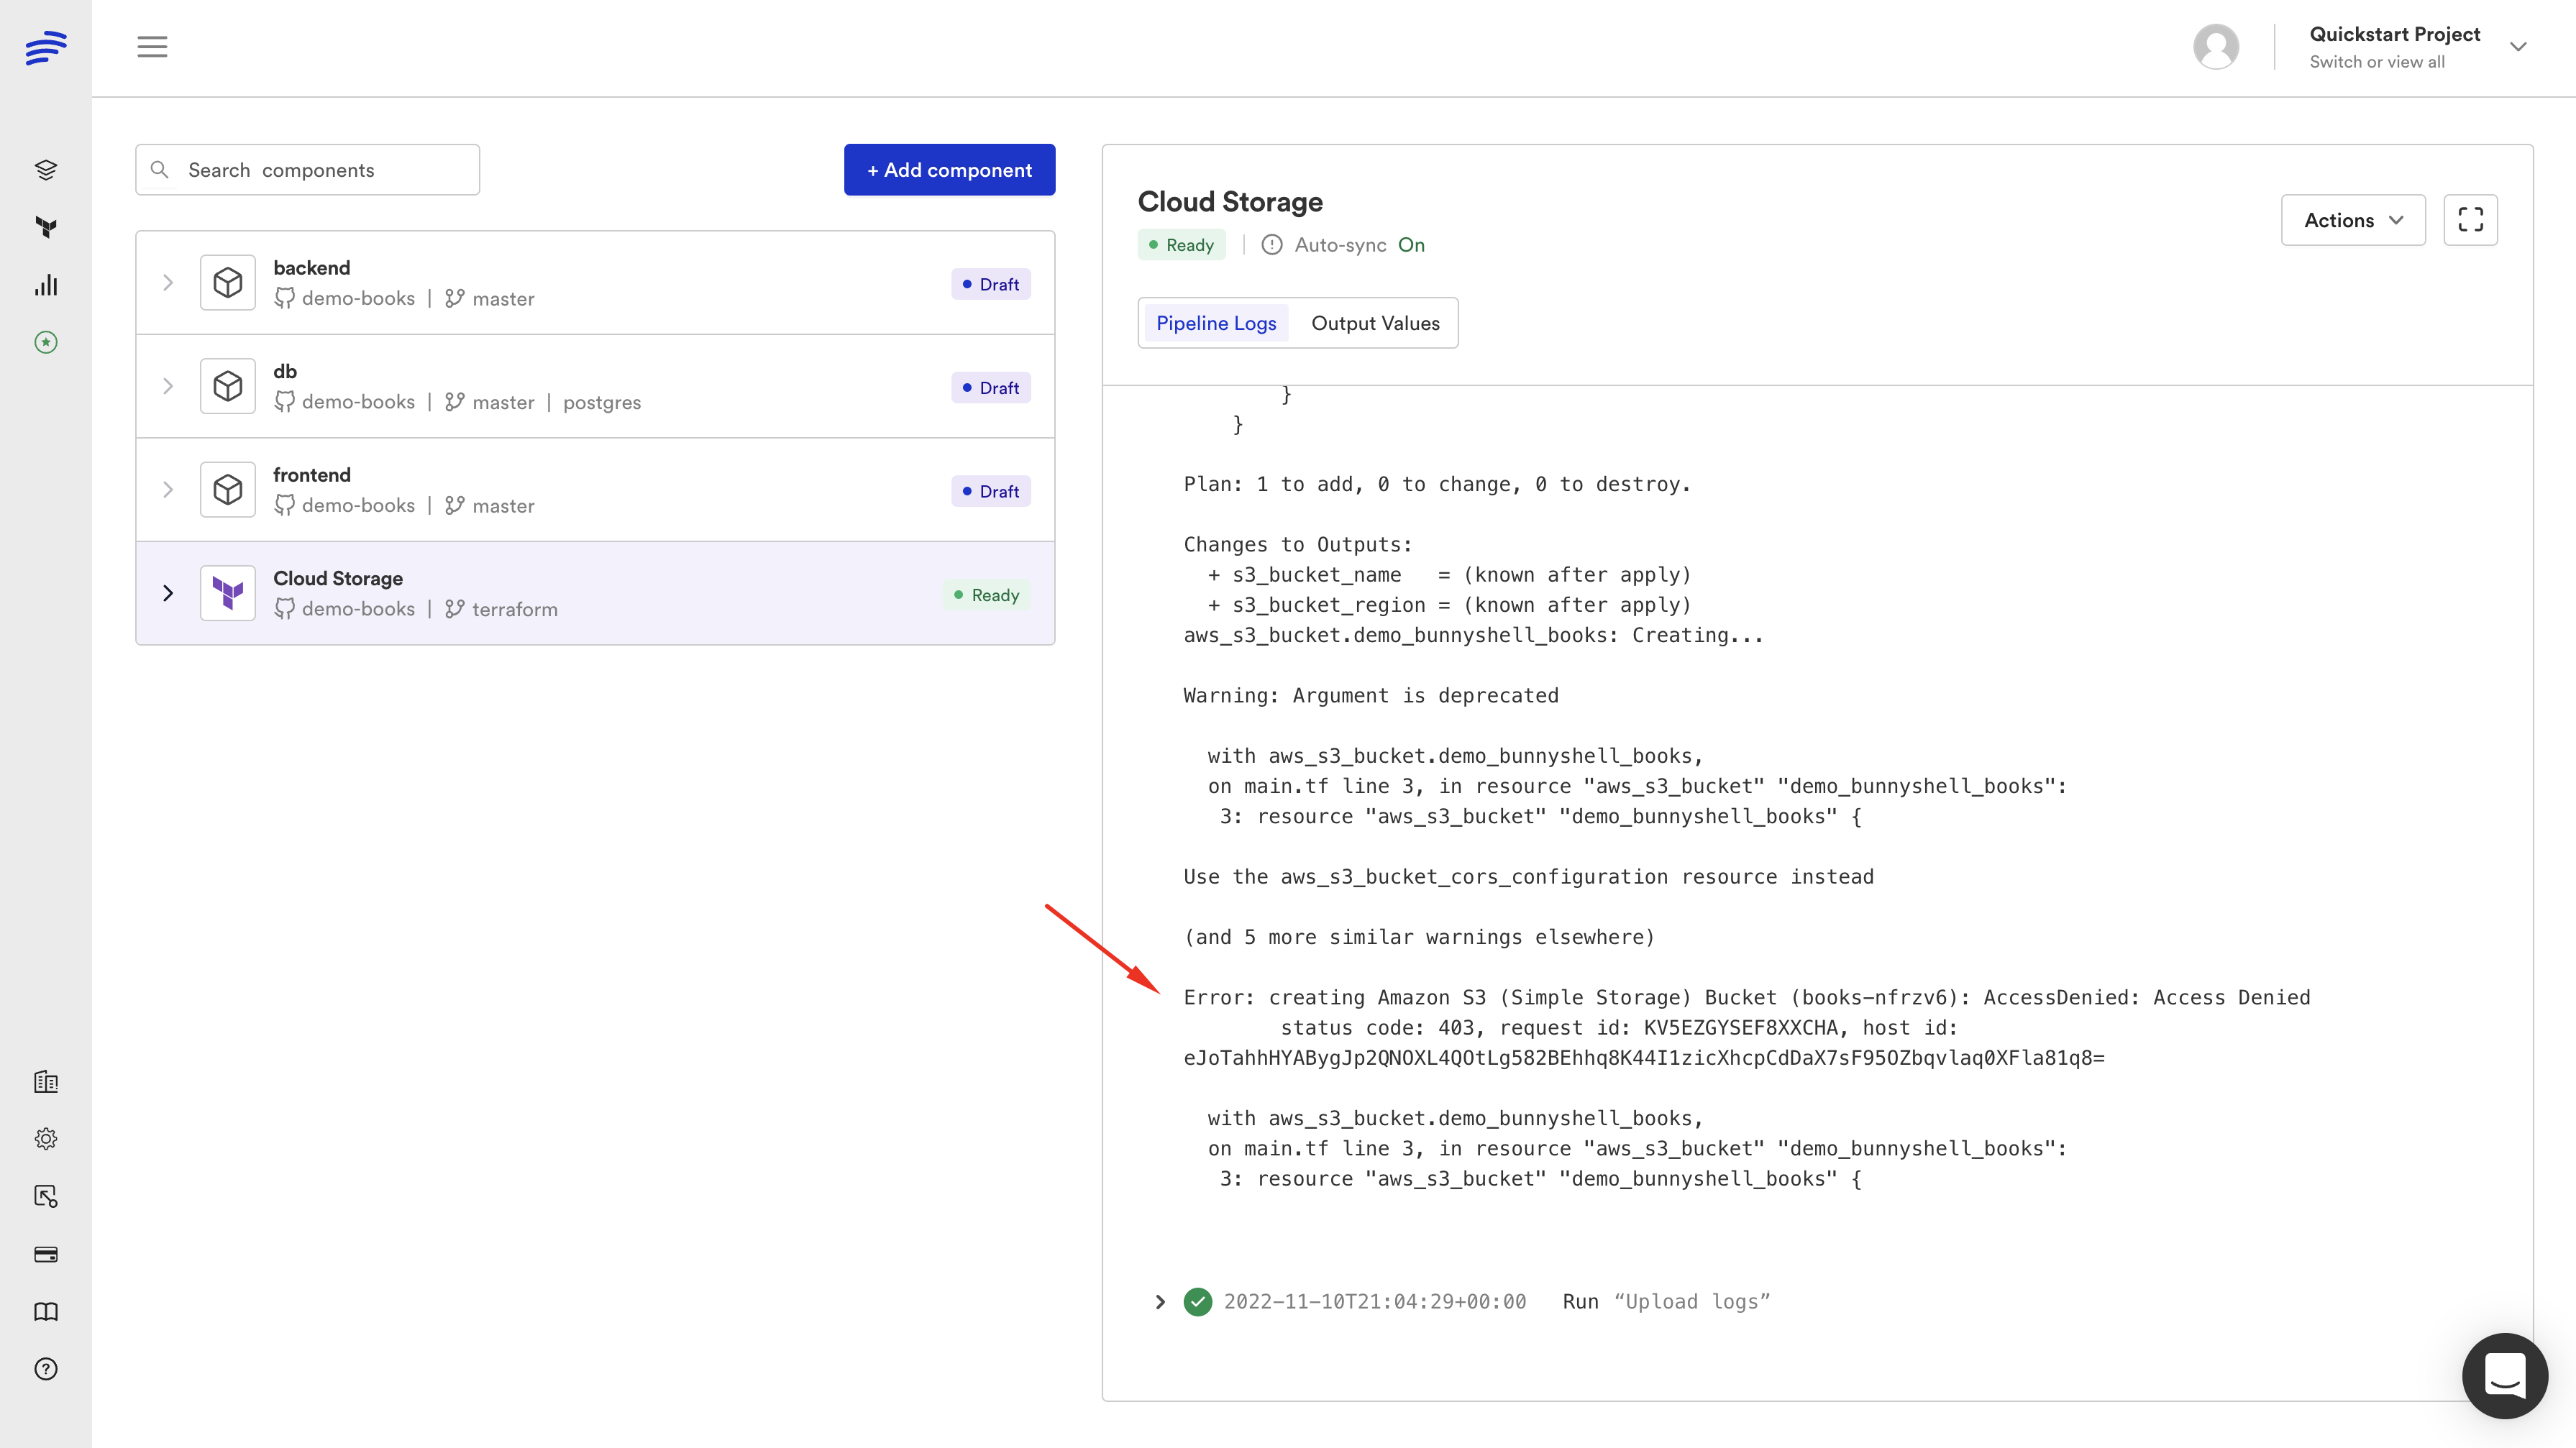
Scrolling down a bit shows us that the issue was an AccessDenied one.
Pipeline view
If we click on the View logs link under the name of the Environment, we will end up in the Pipeline details page. You can get there as well by clicking on the Pipelines button in the top right of the Environment Details screen.
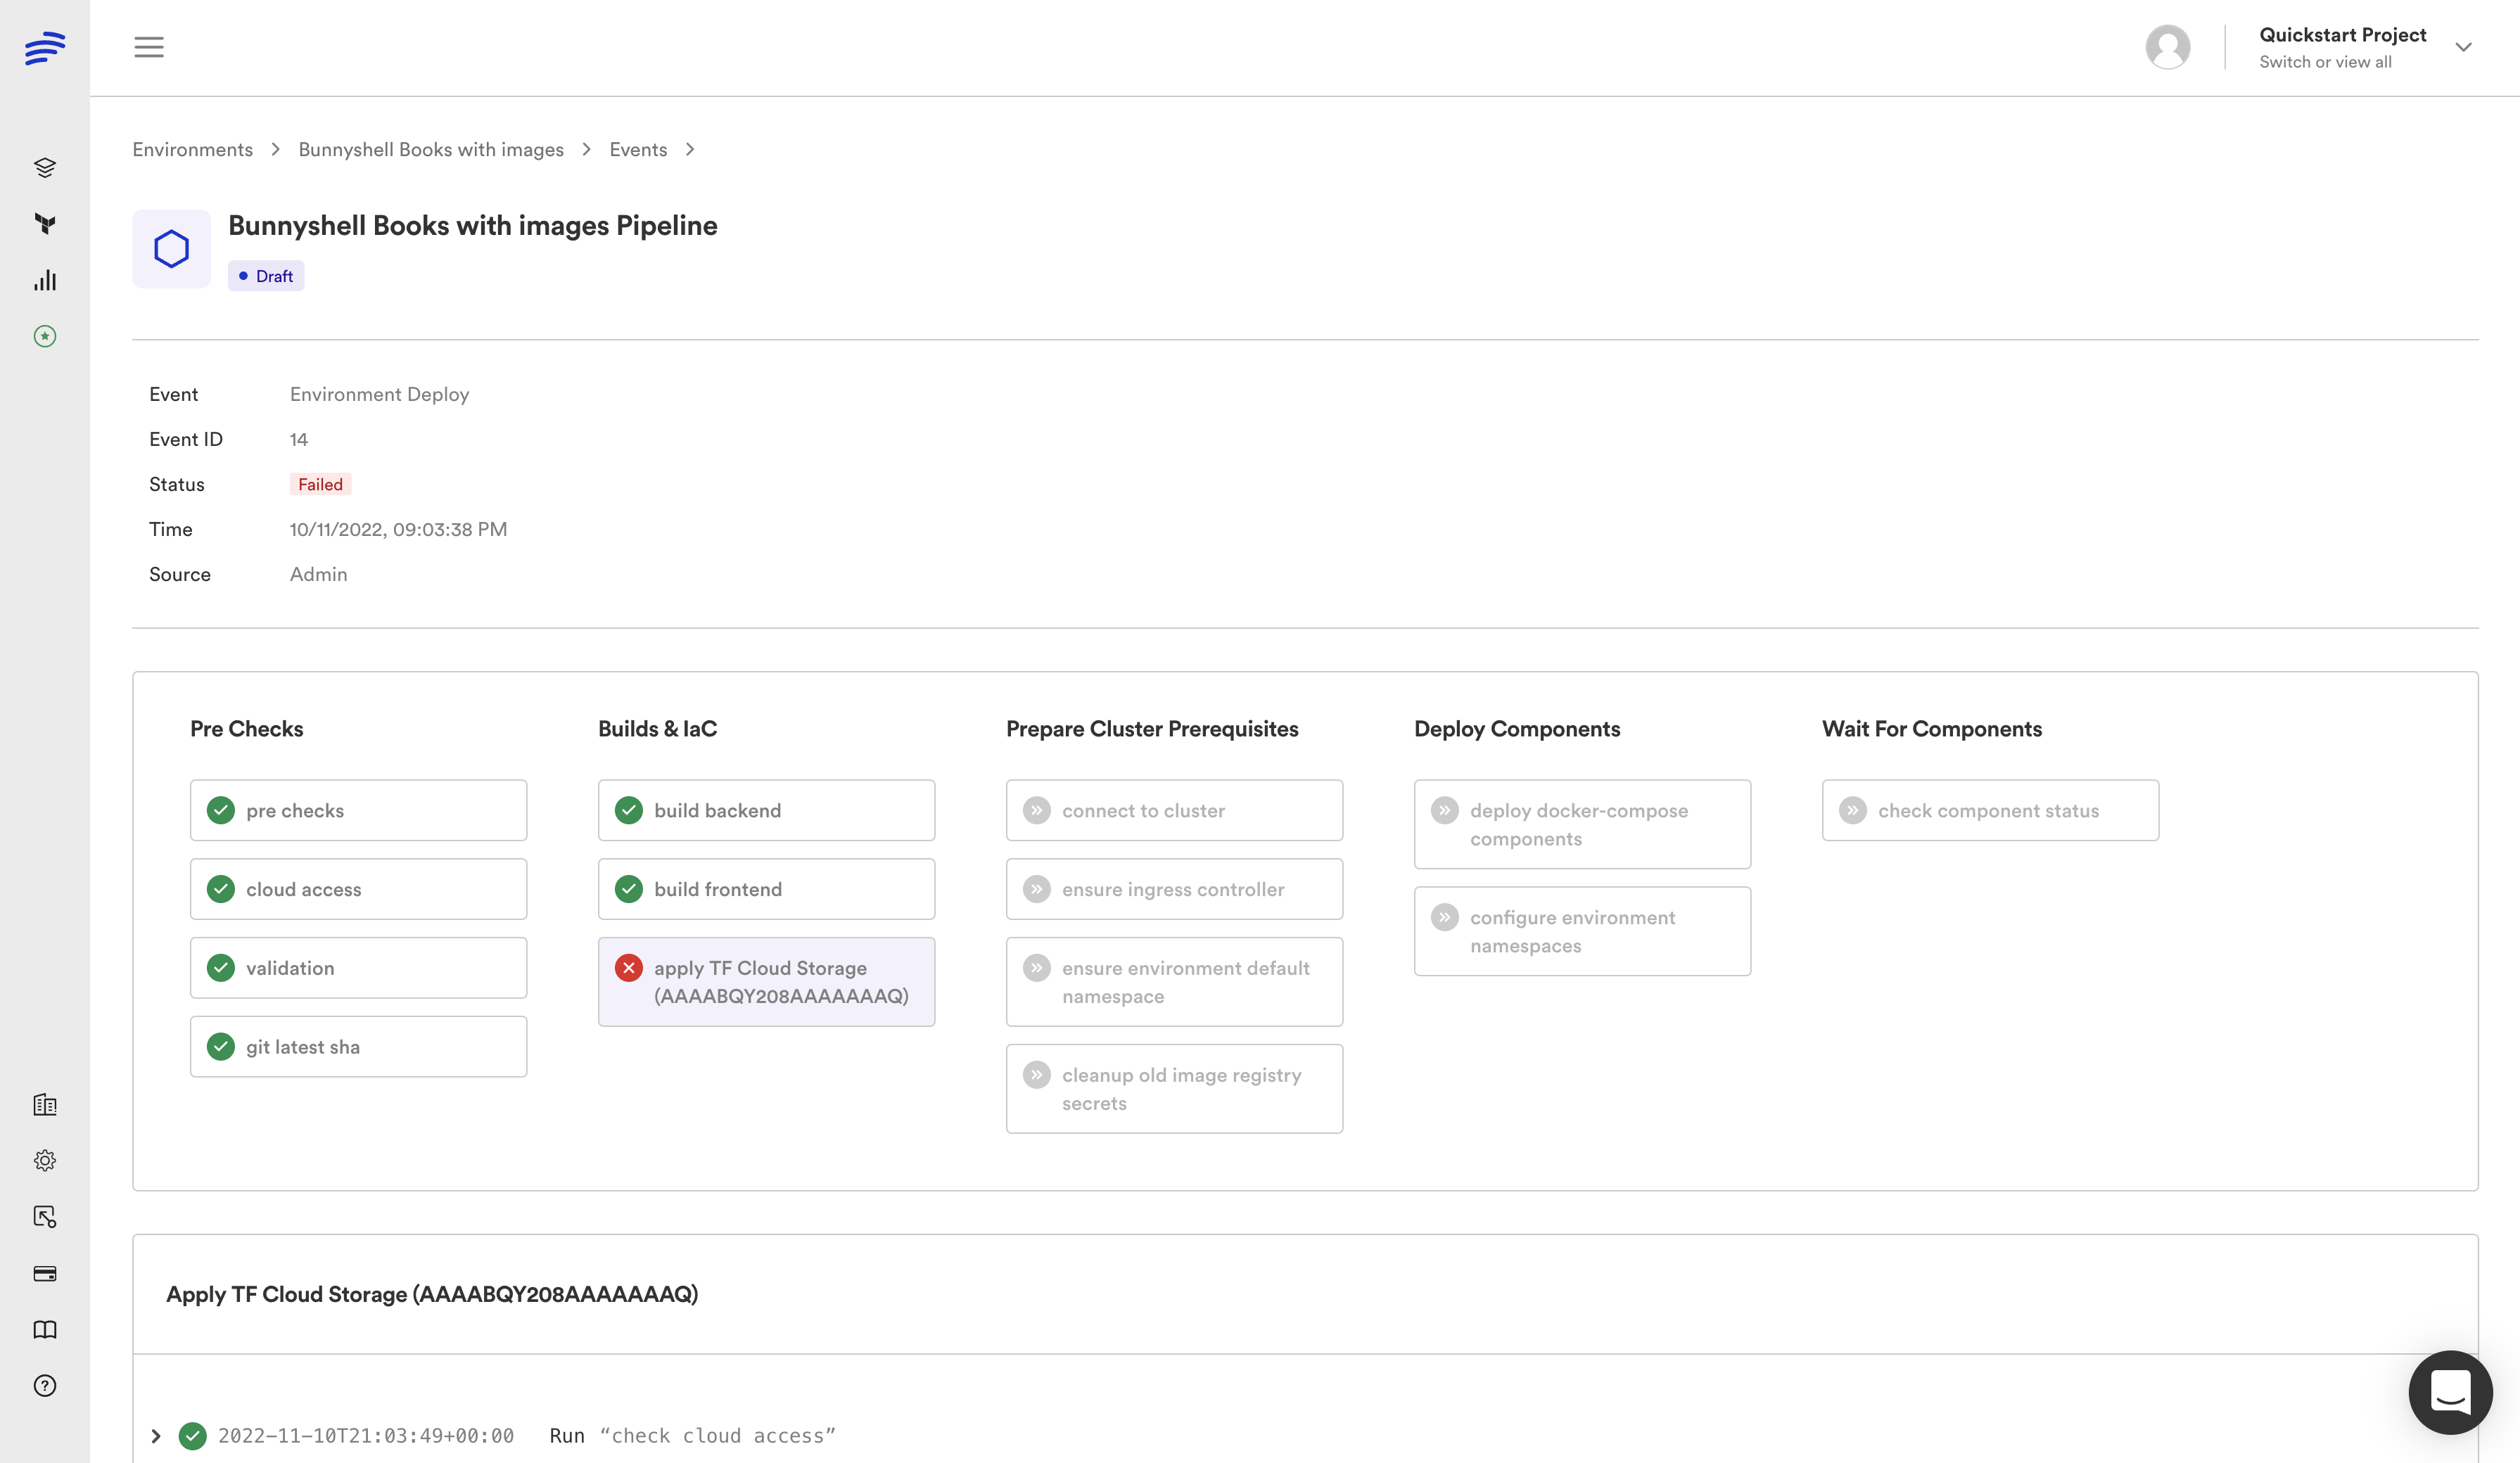
You will be able to easily see the failed Job, and then the failed Step of the Job.
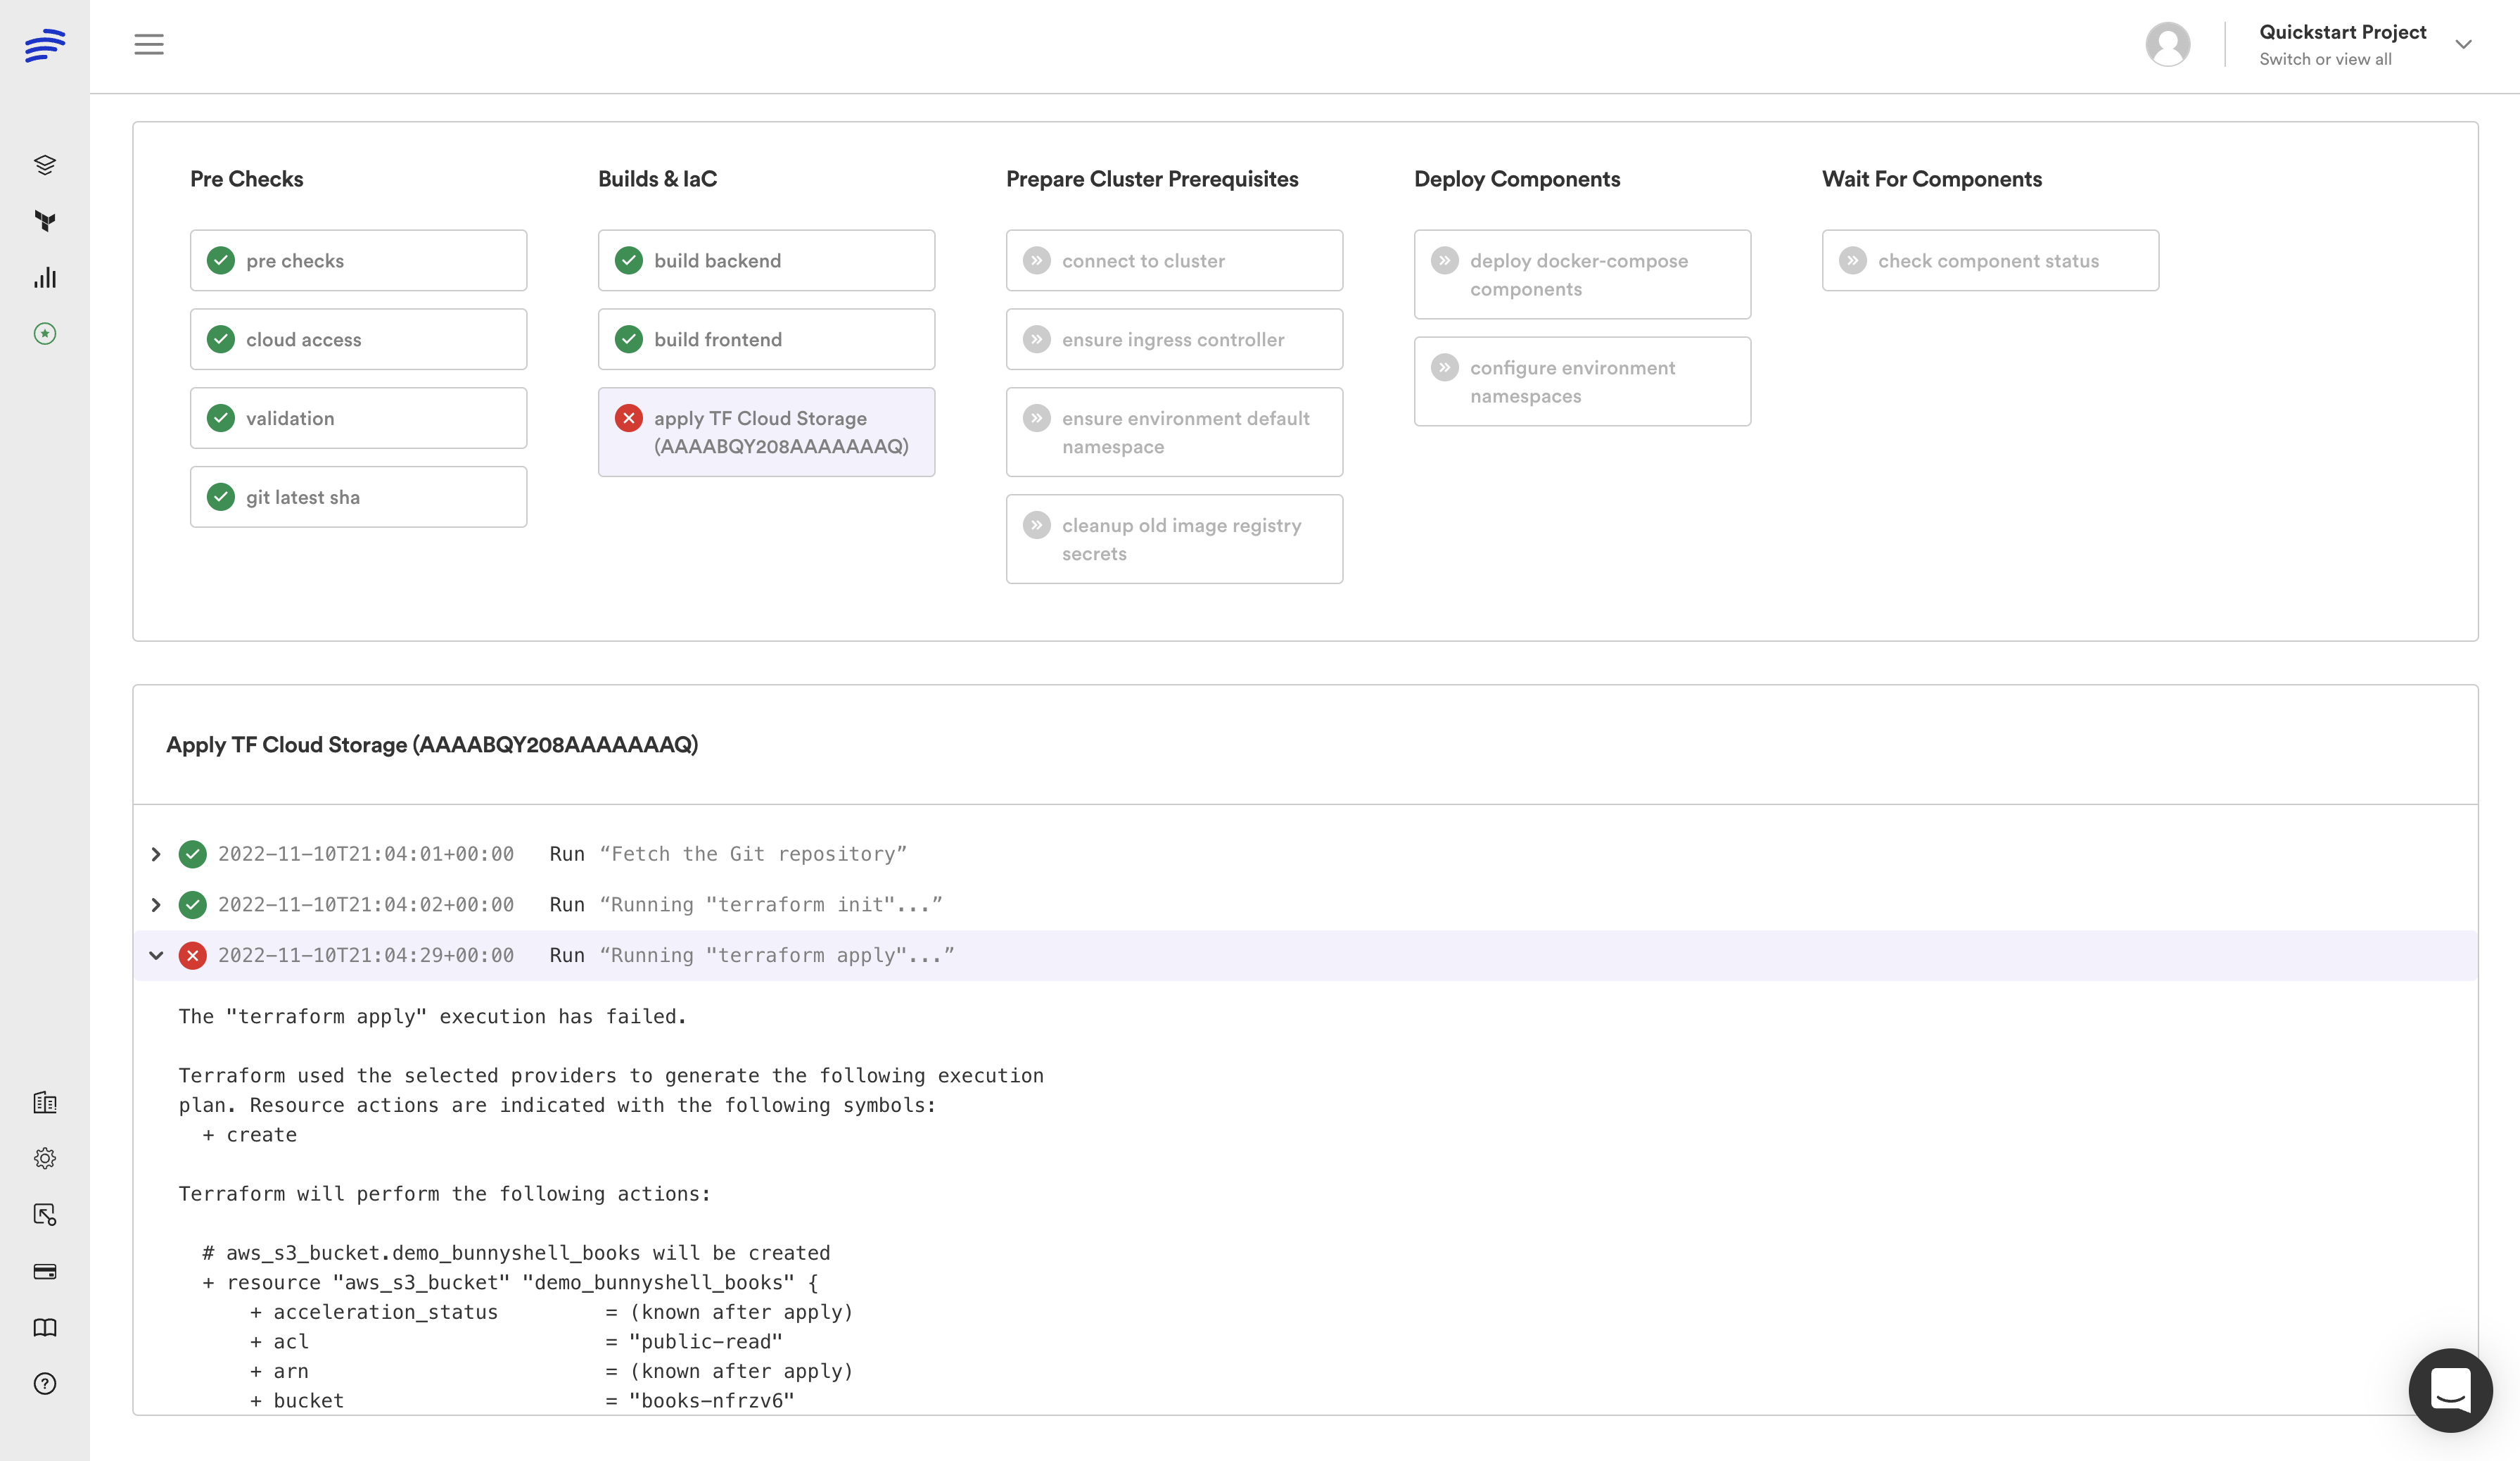
Scrolling down, you can pinpoint the issue from this screen as well.
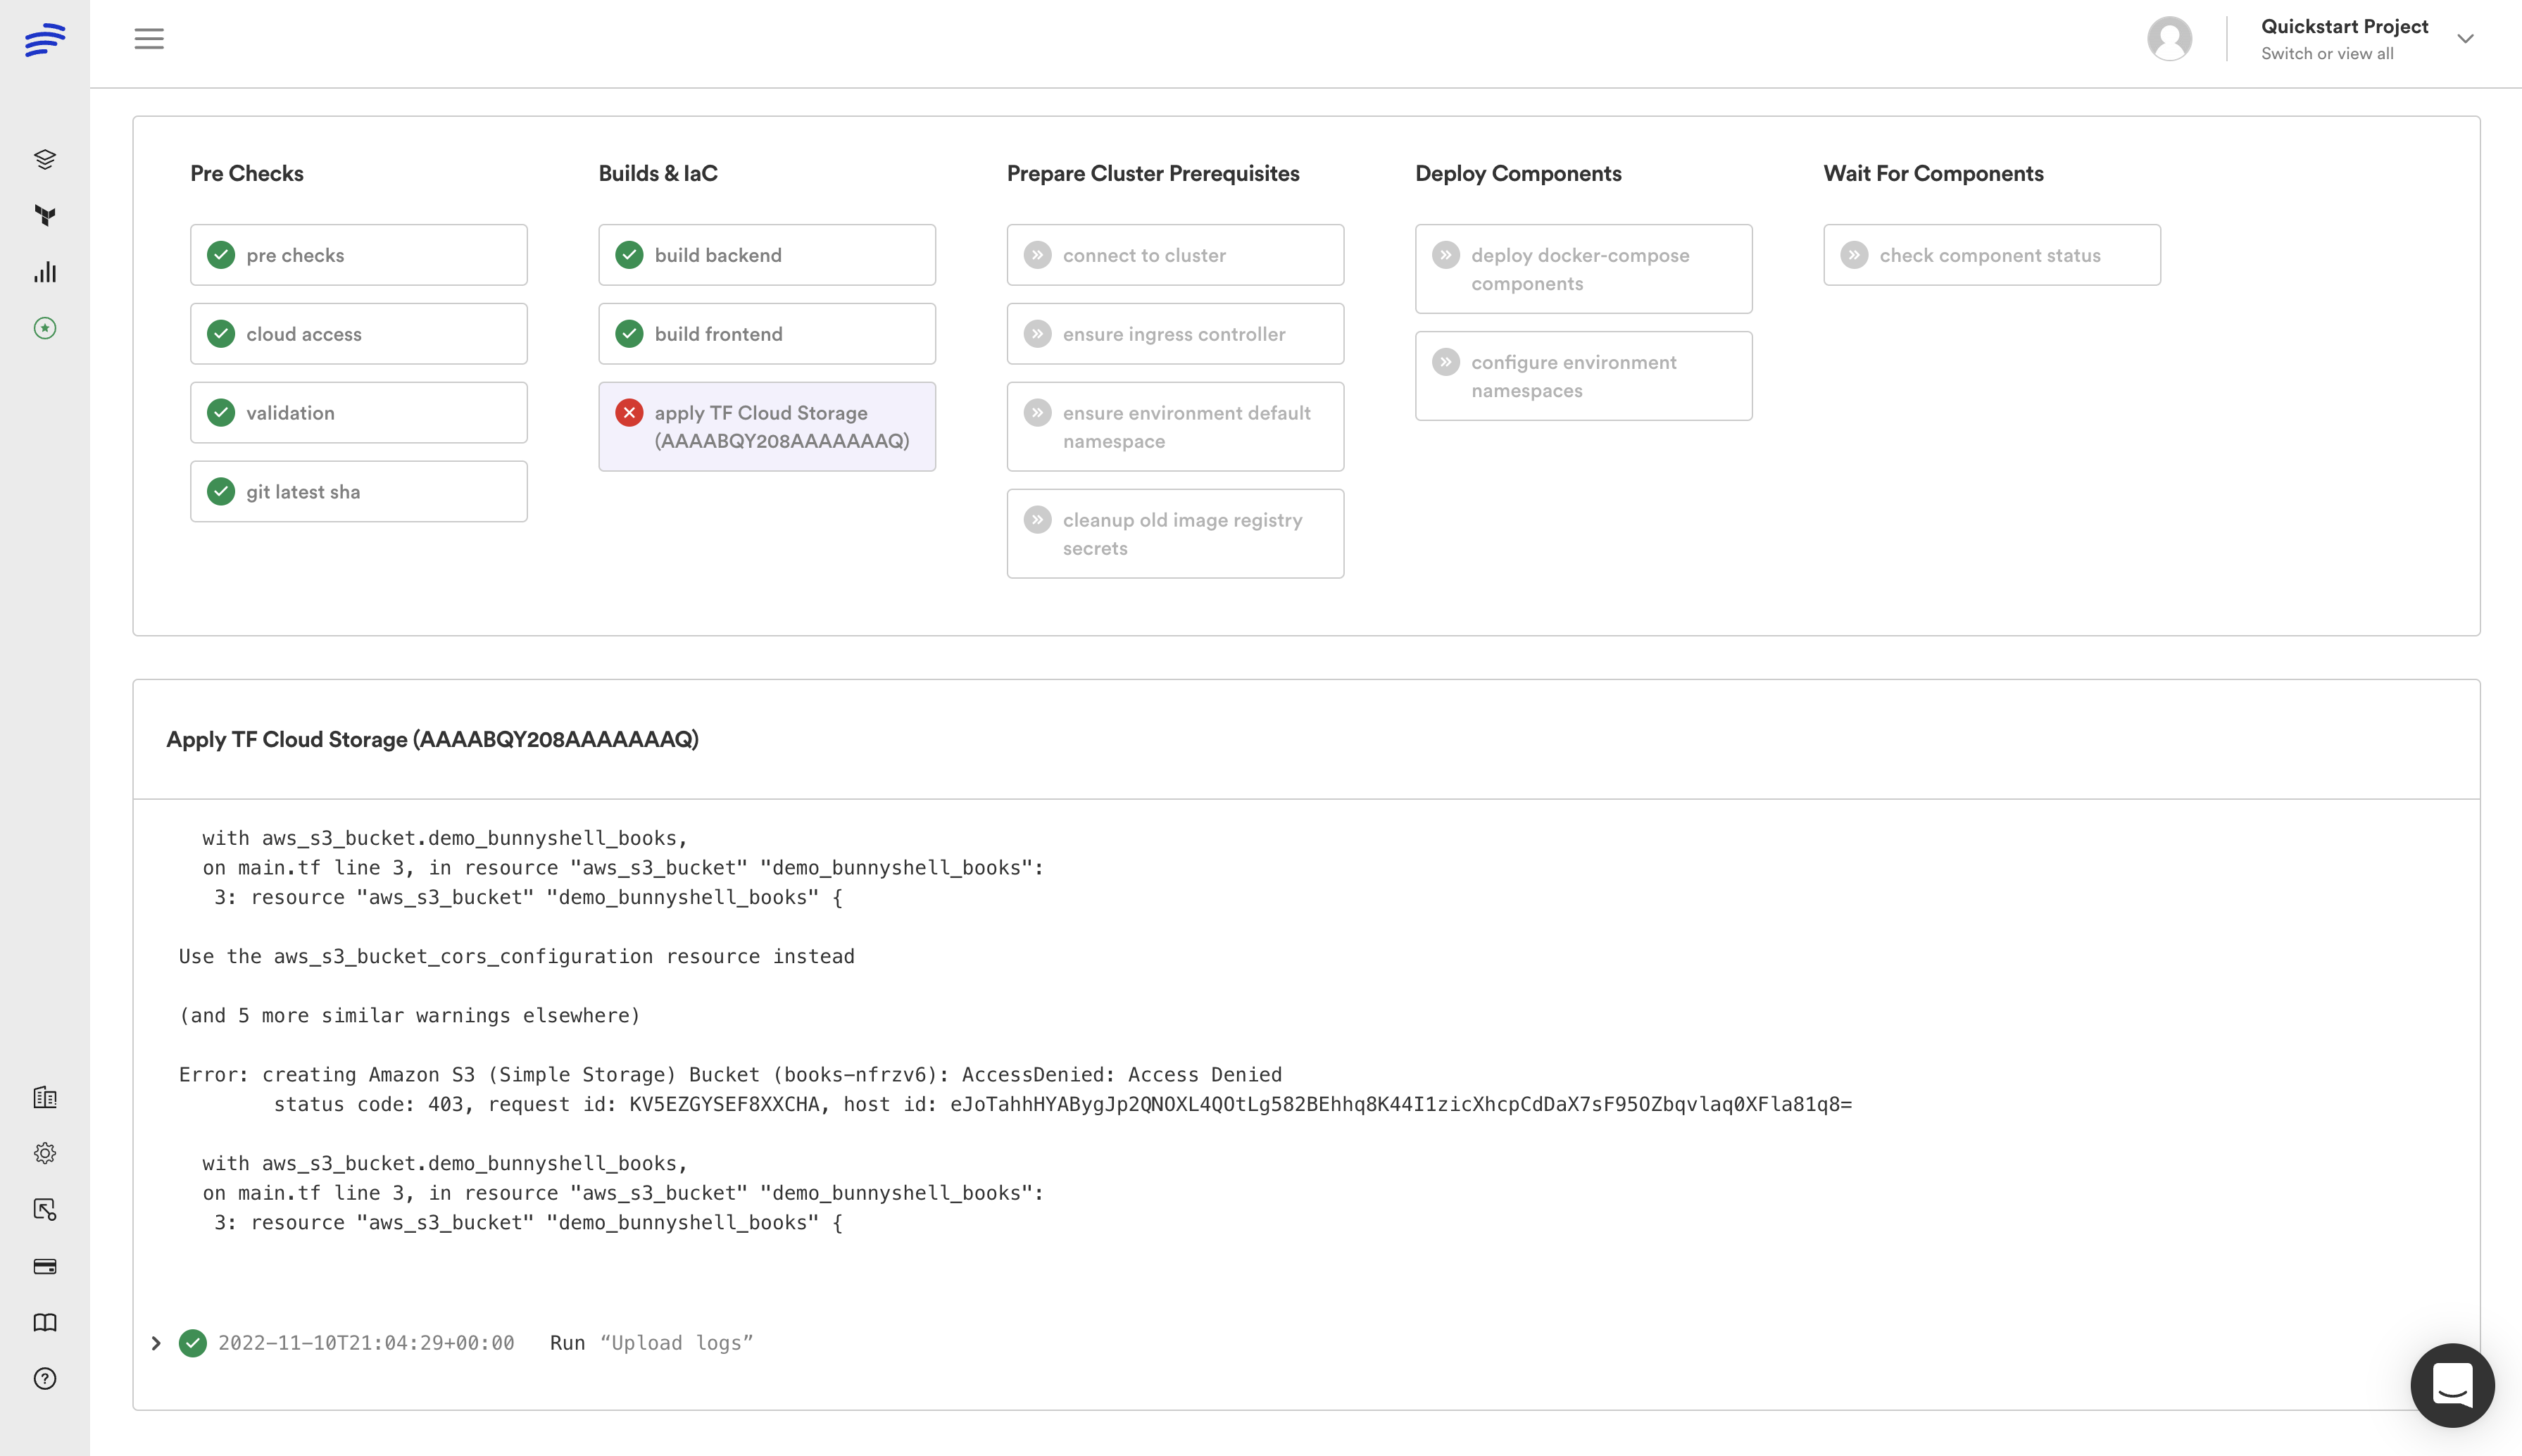
The Pipeline view offer a more holistic understanding of the workflow to be ran, understanding where a given step falls in the process, and what else was failed or skipped due to a Terraform Module failing to apply.
Updated 8 months ago
