Debugging frontend in VS Code
Let's take an example, based on our Demo Books application.
Context
Assuming we have a development Environment based on Demo Books, with an Angular frontend Component.
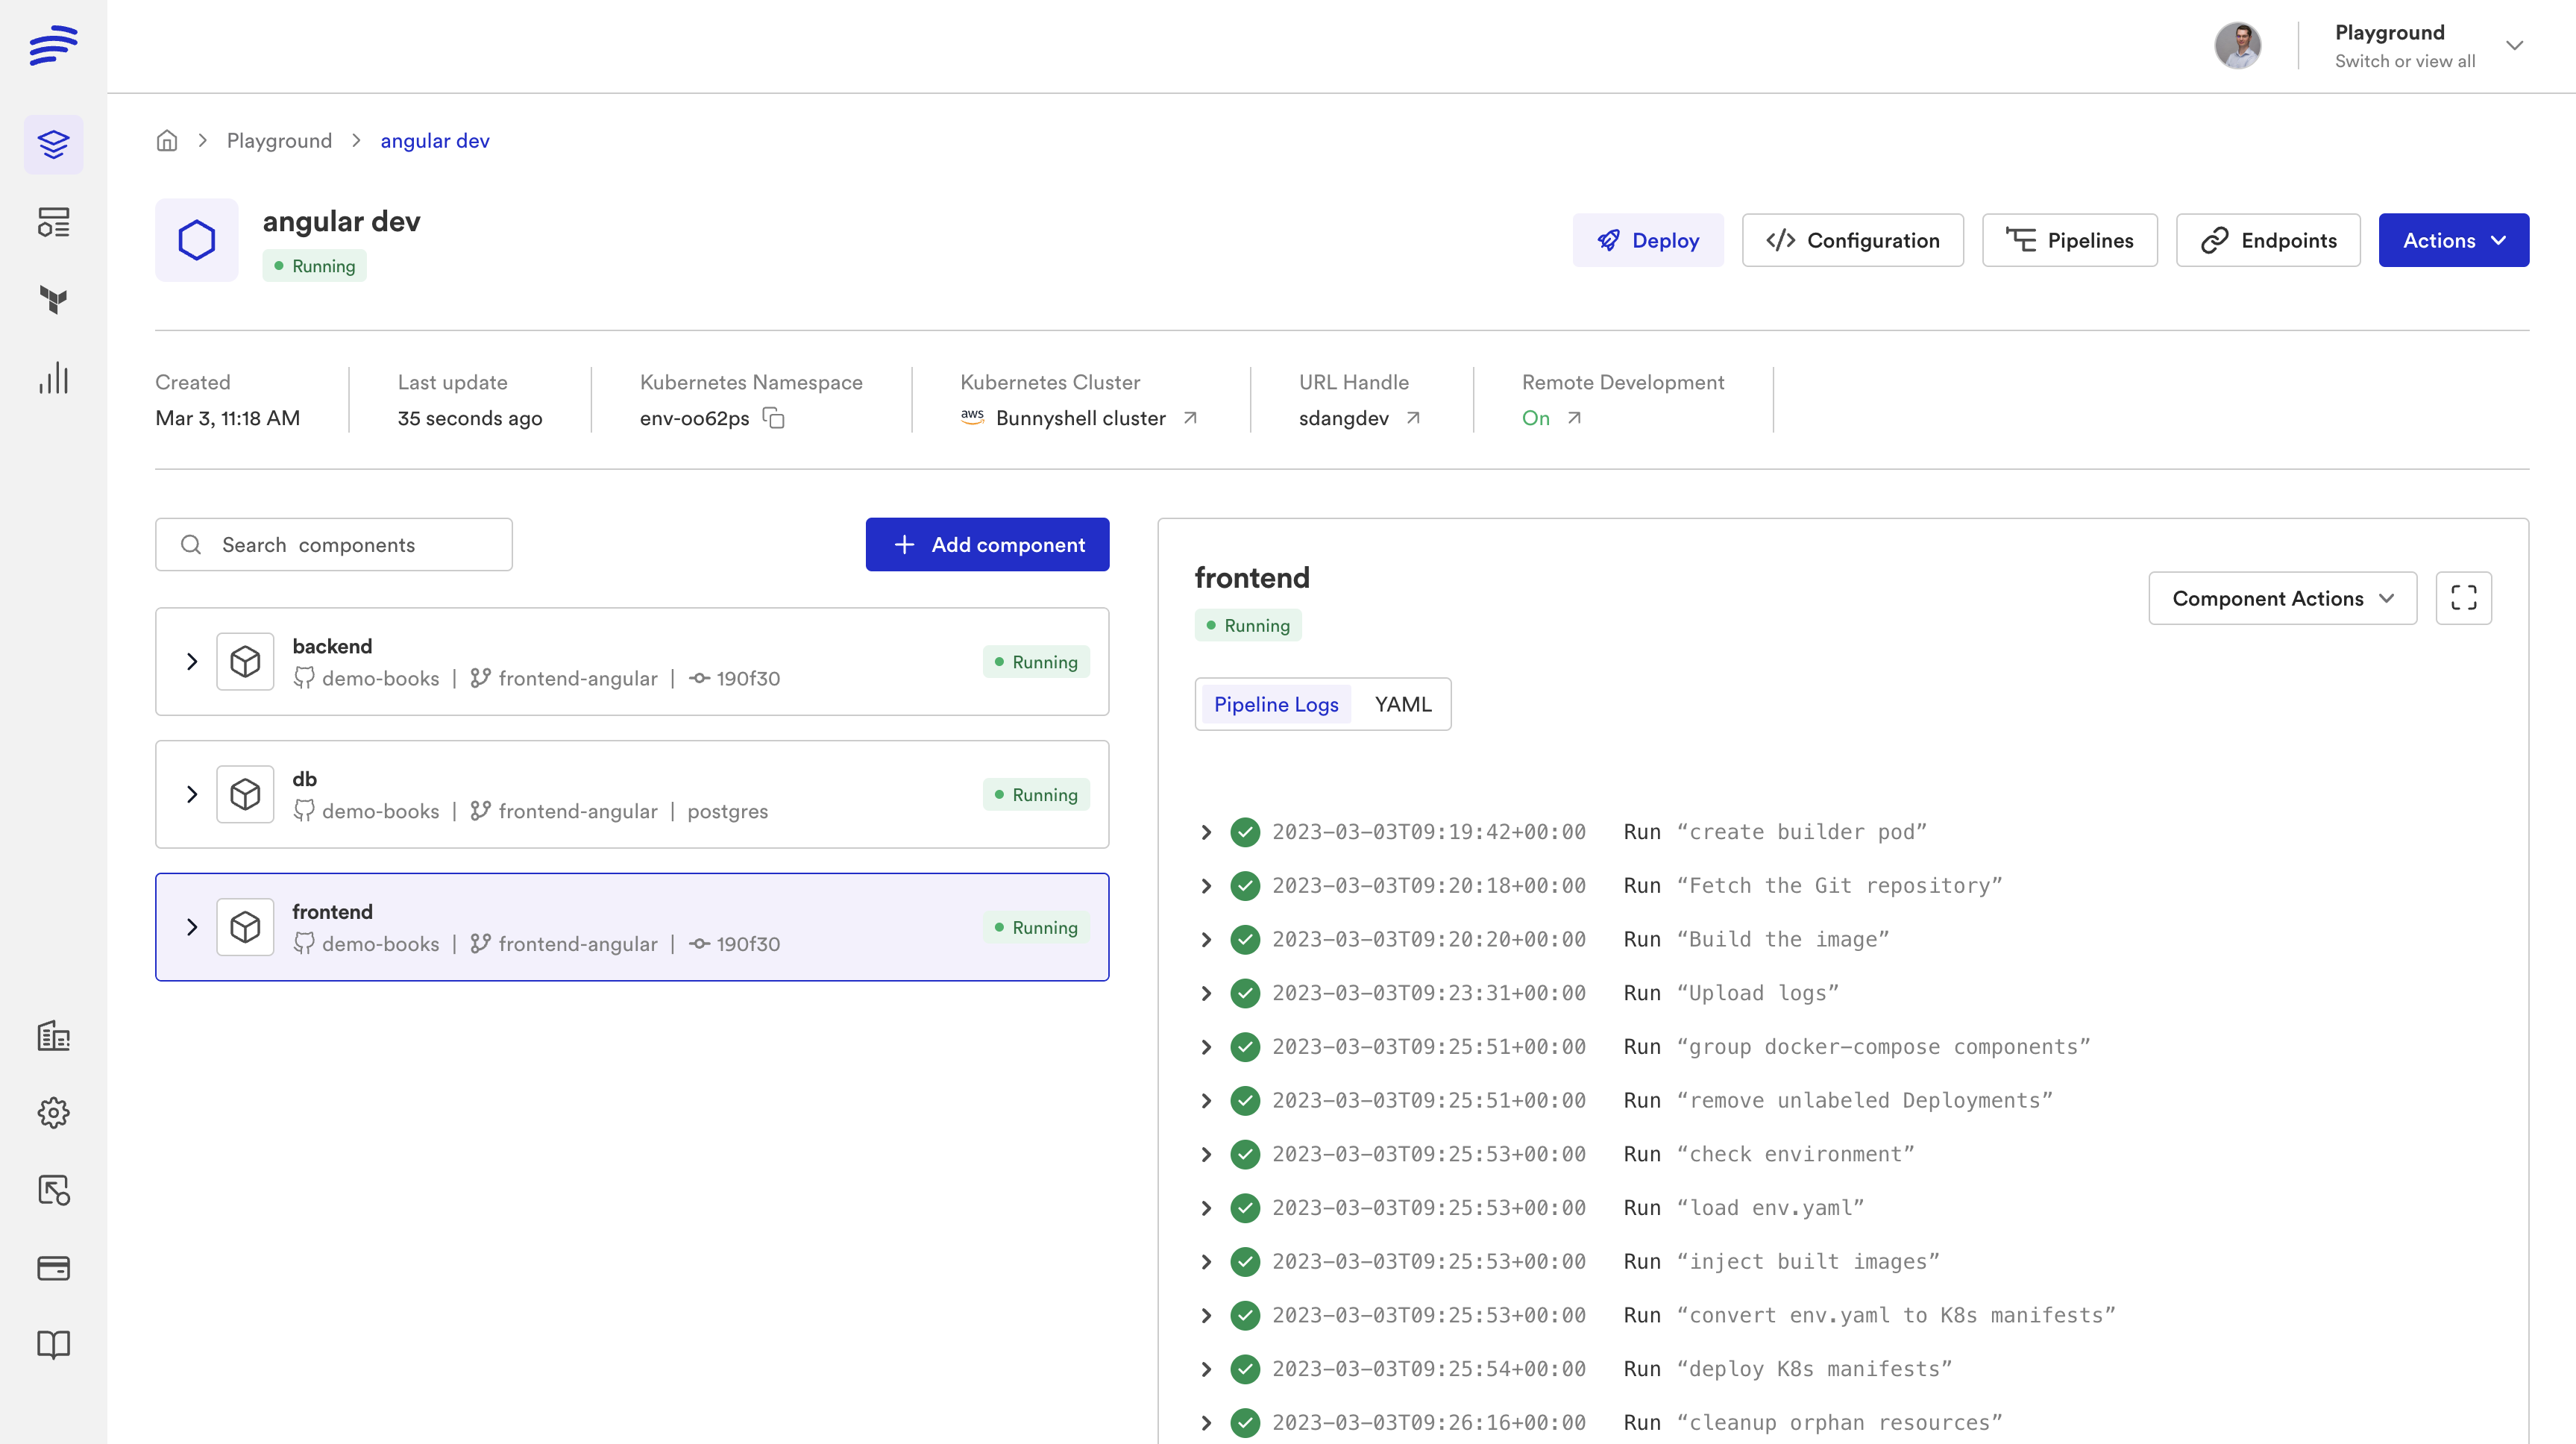
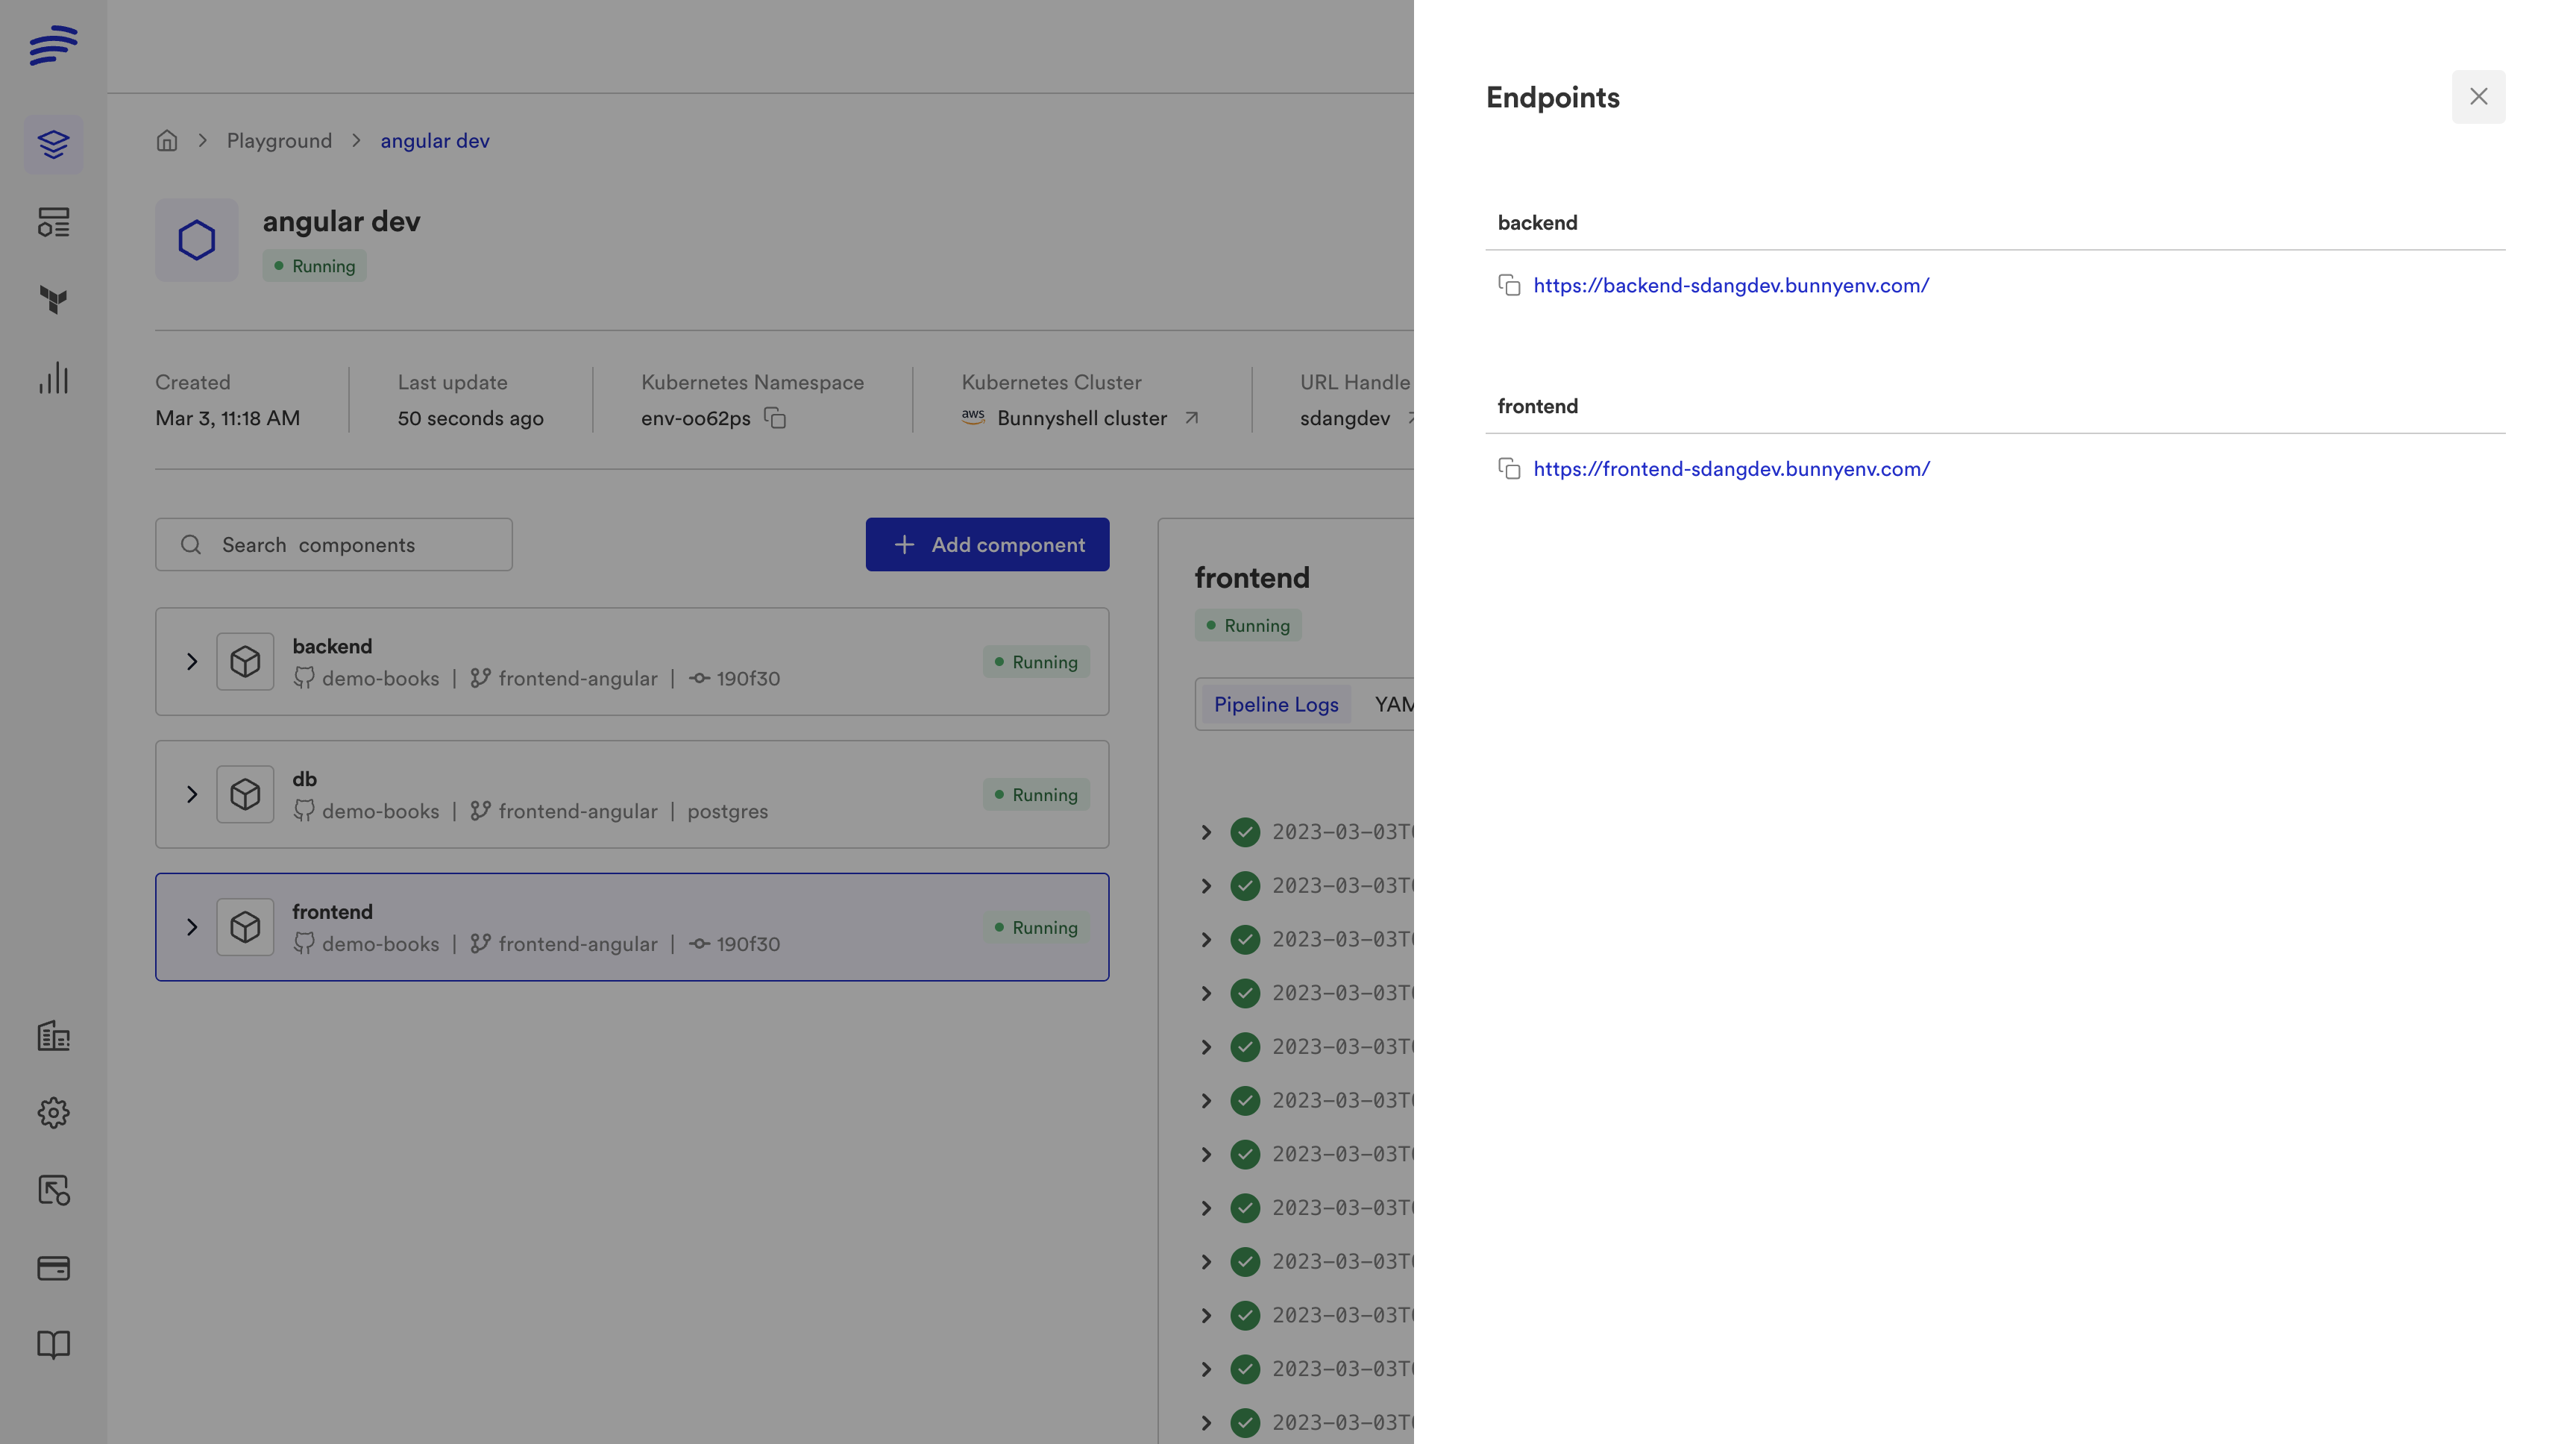
And the frontend URL is https://frontend-sdangdev.bunnyenv.com/.
Let's take a look at how to...
Configure the IDE
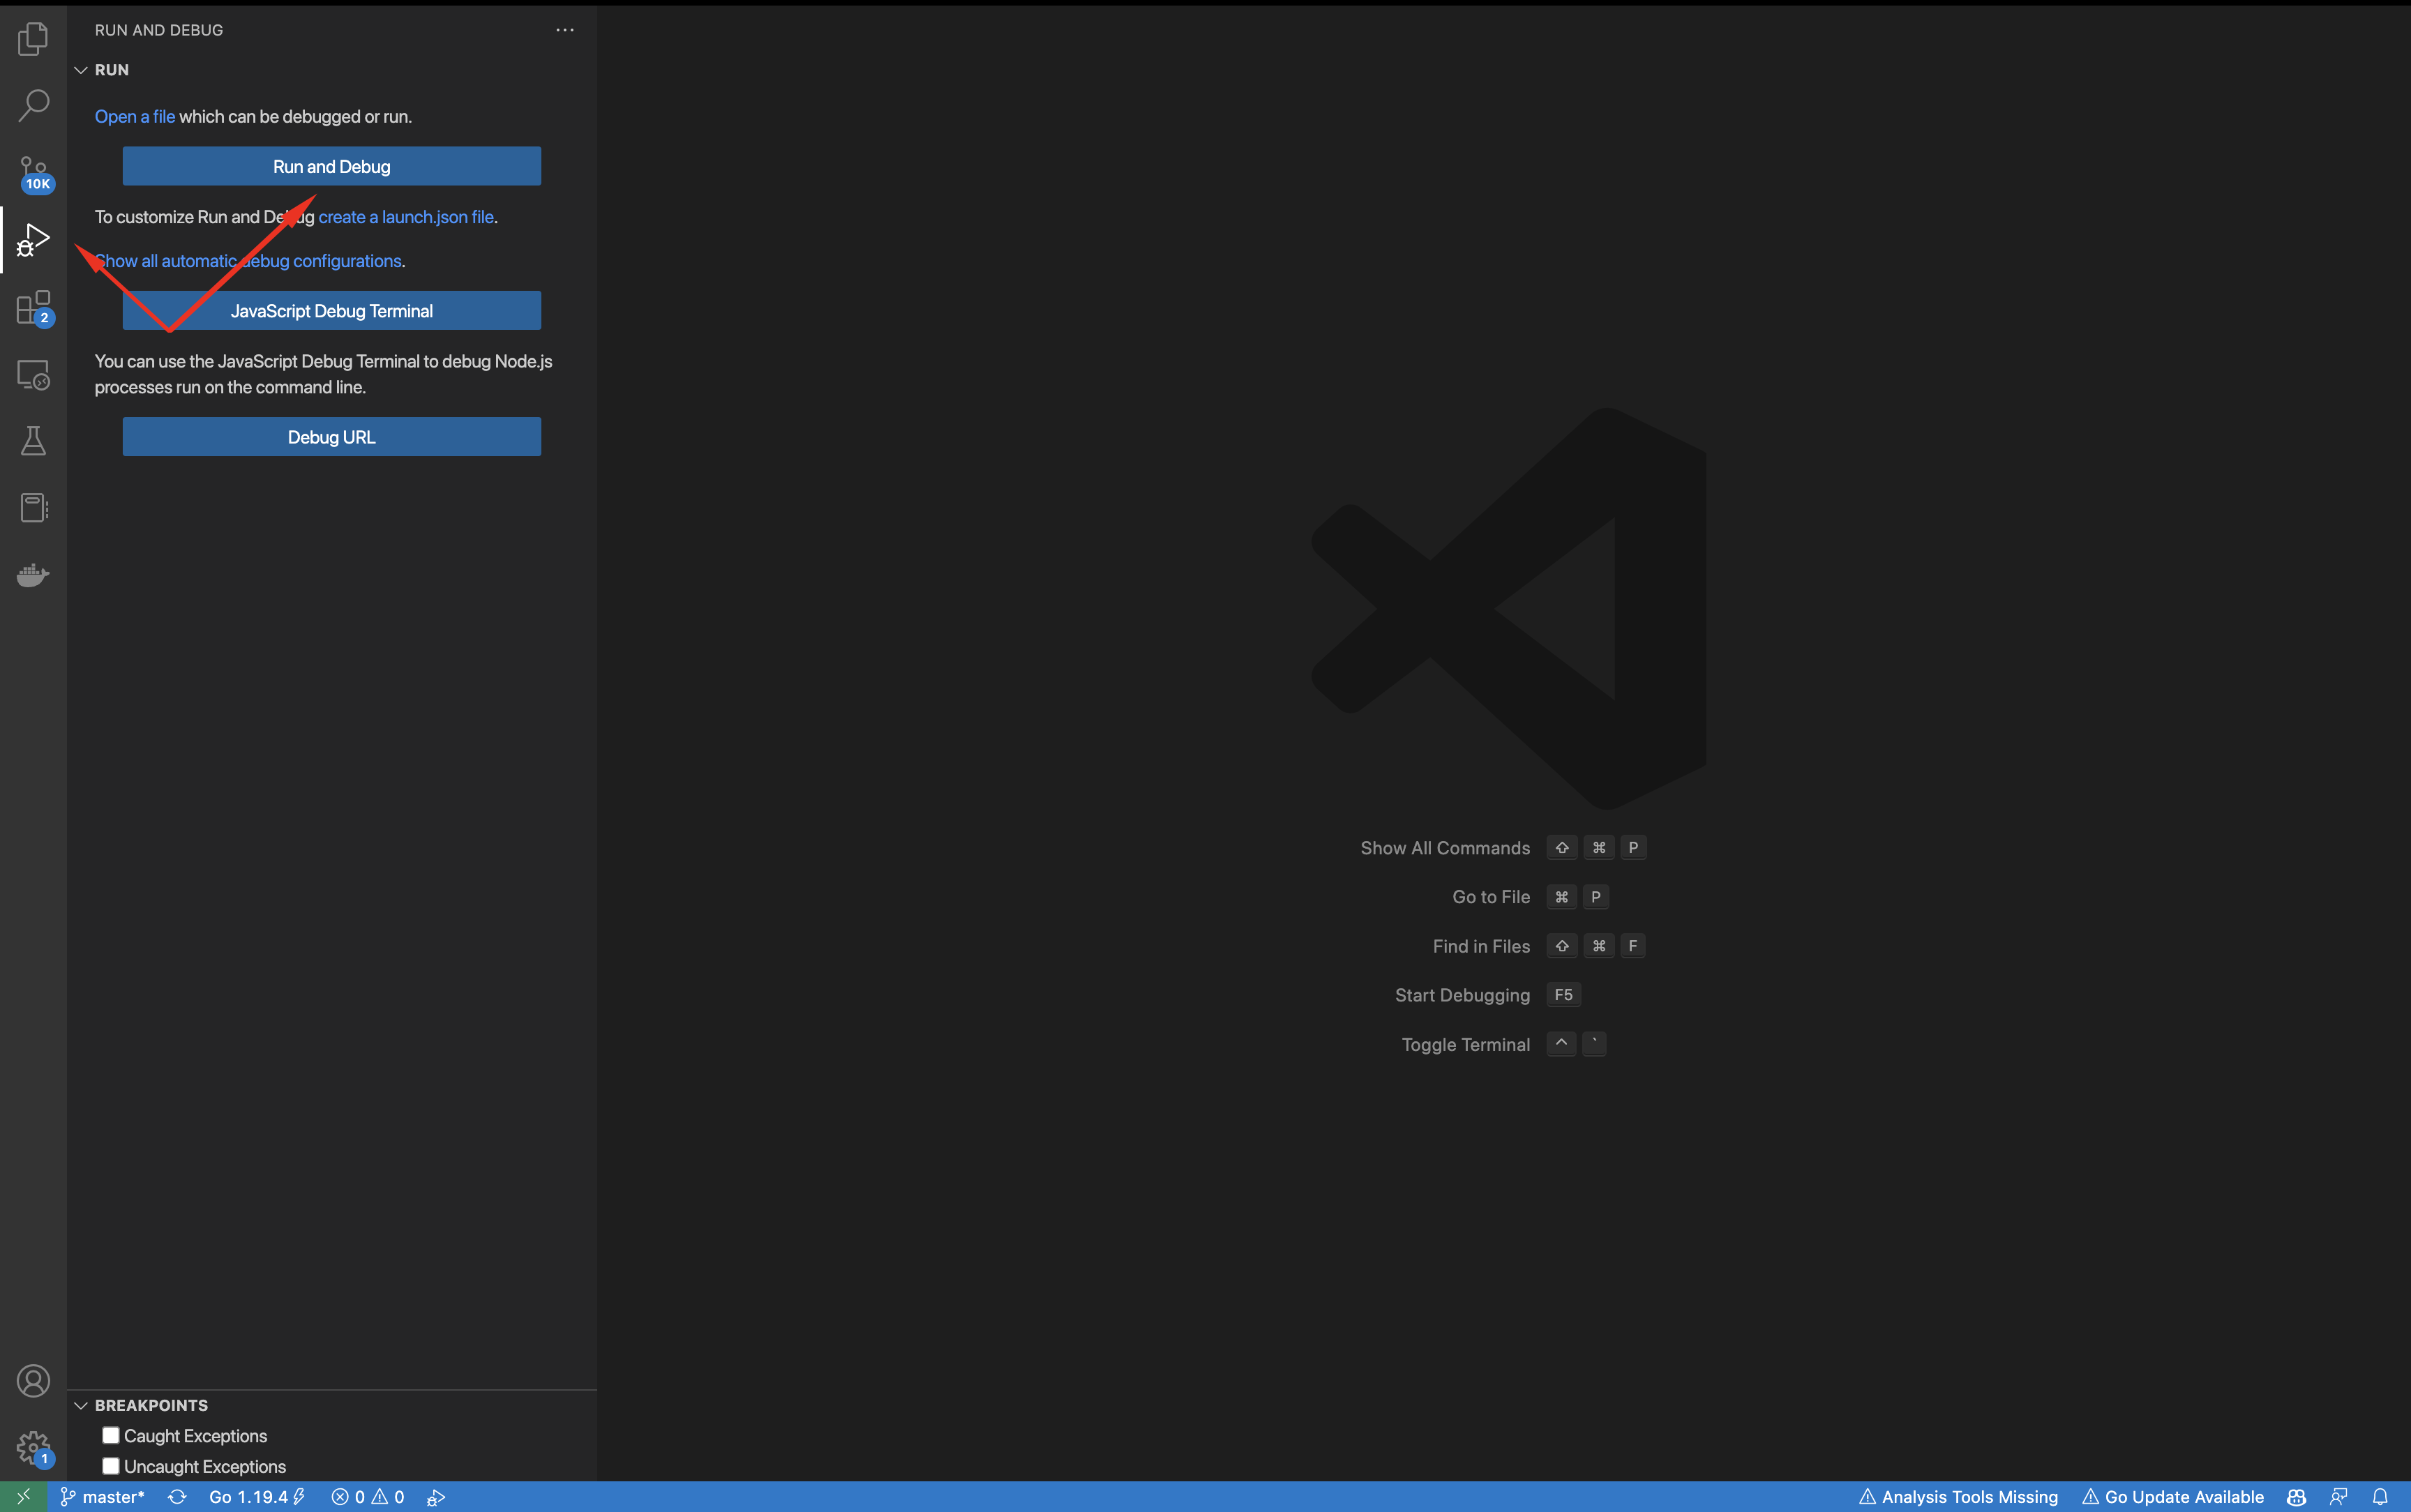
- Go to the Debug panel on the left navigation menu. Then select Run and Debug.
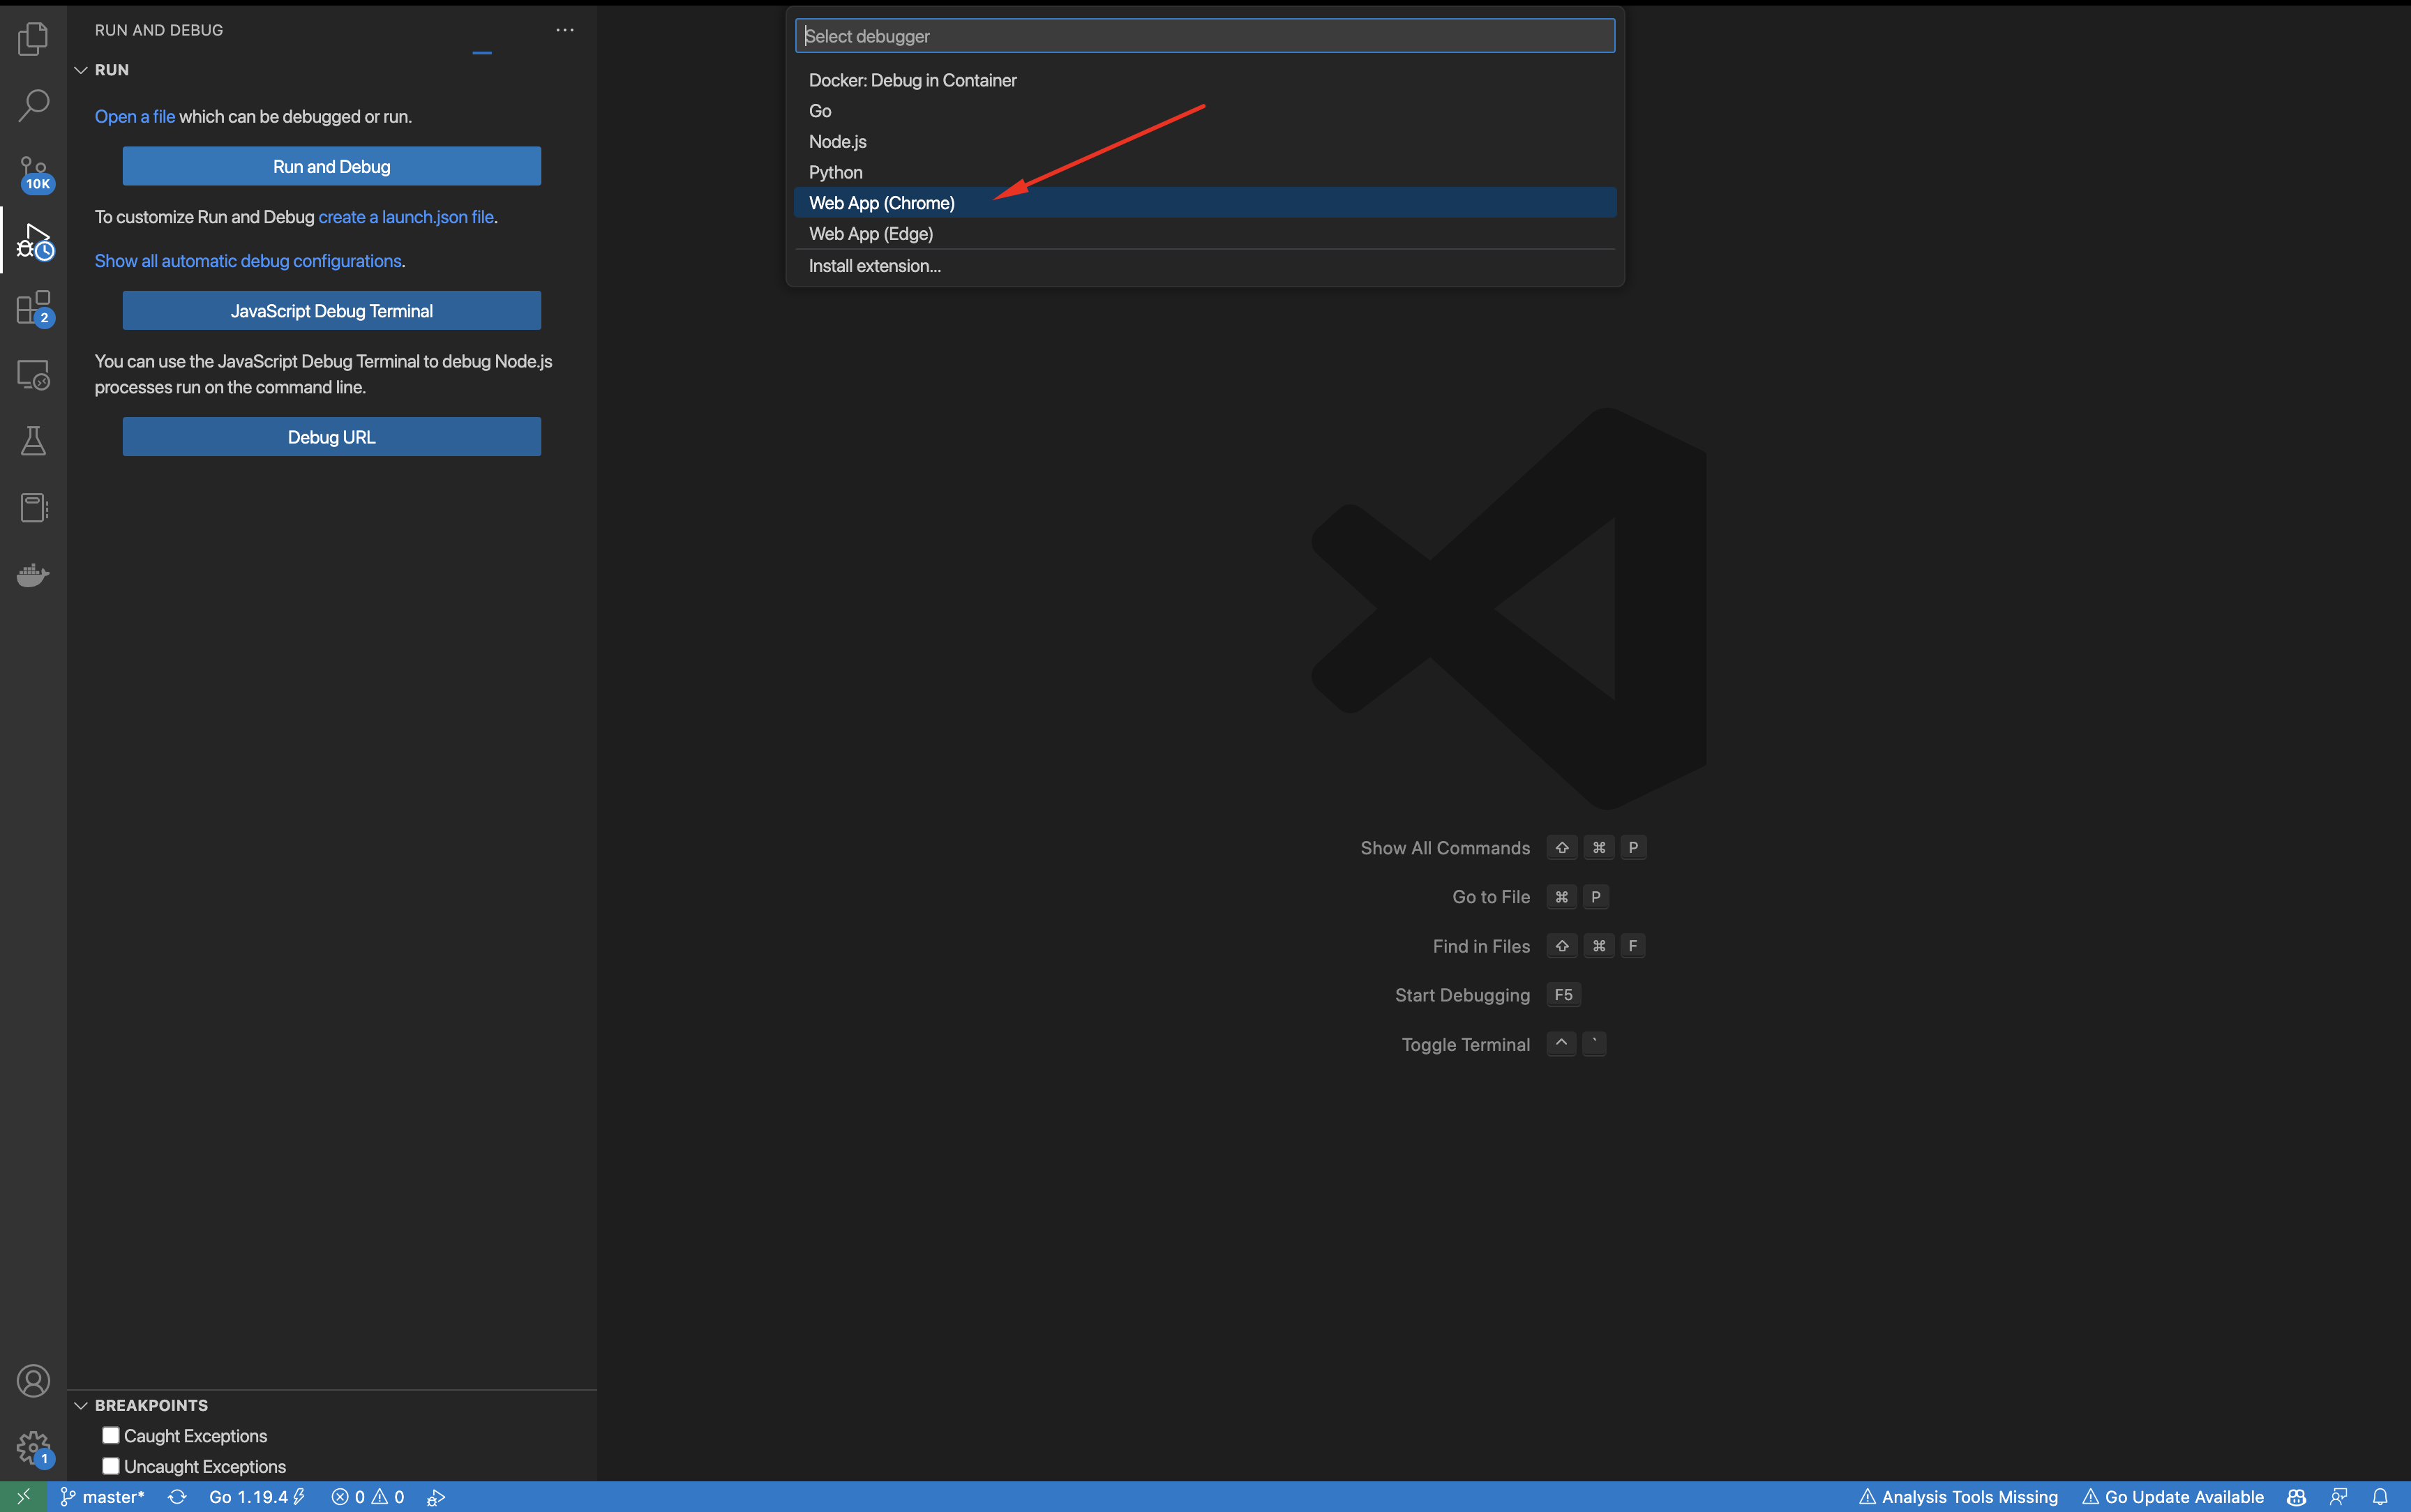
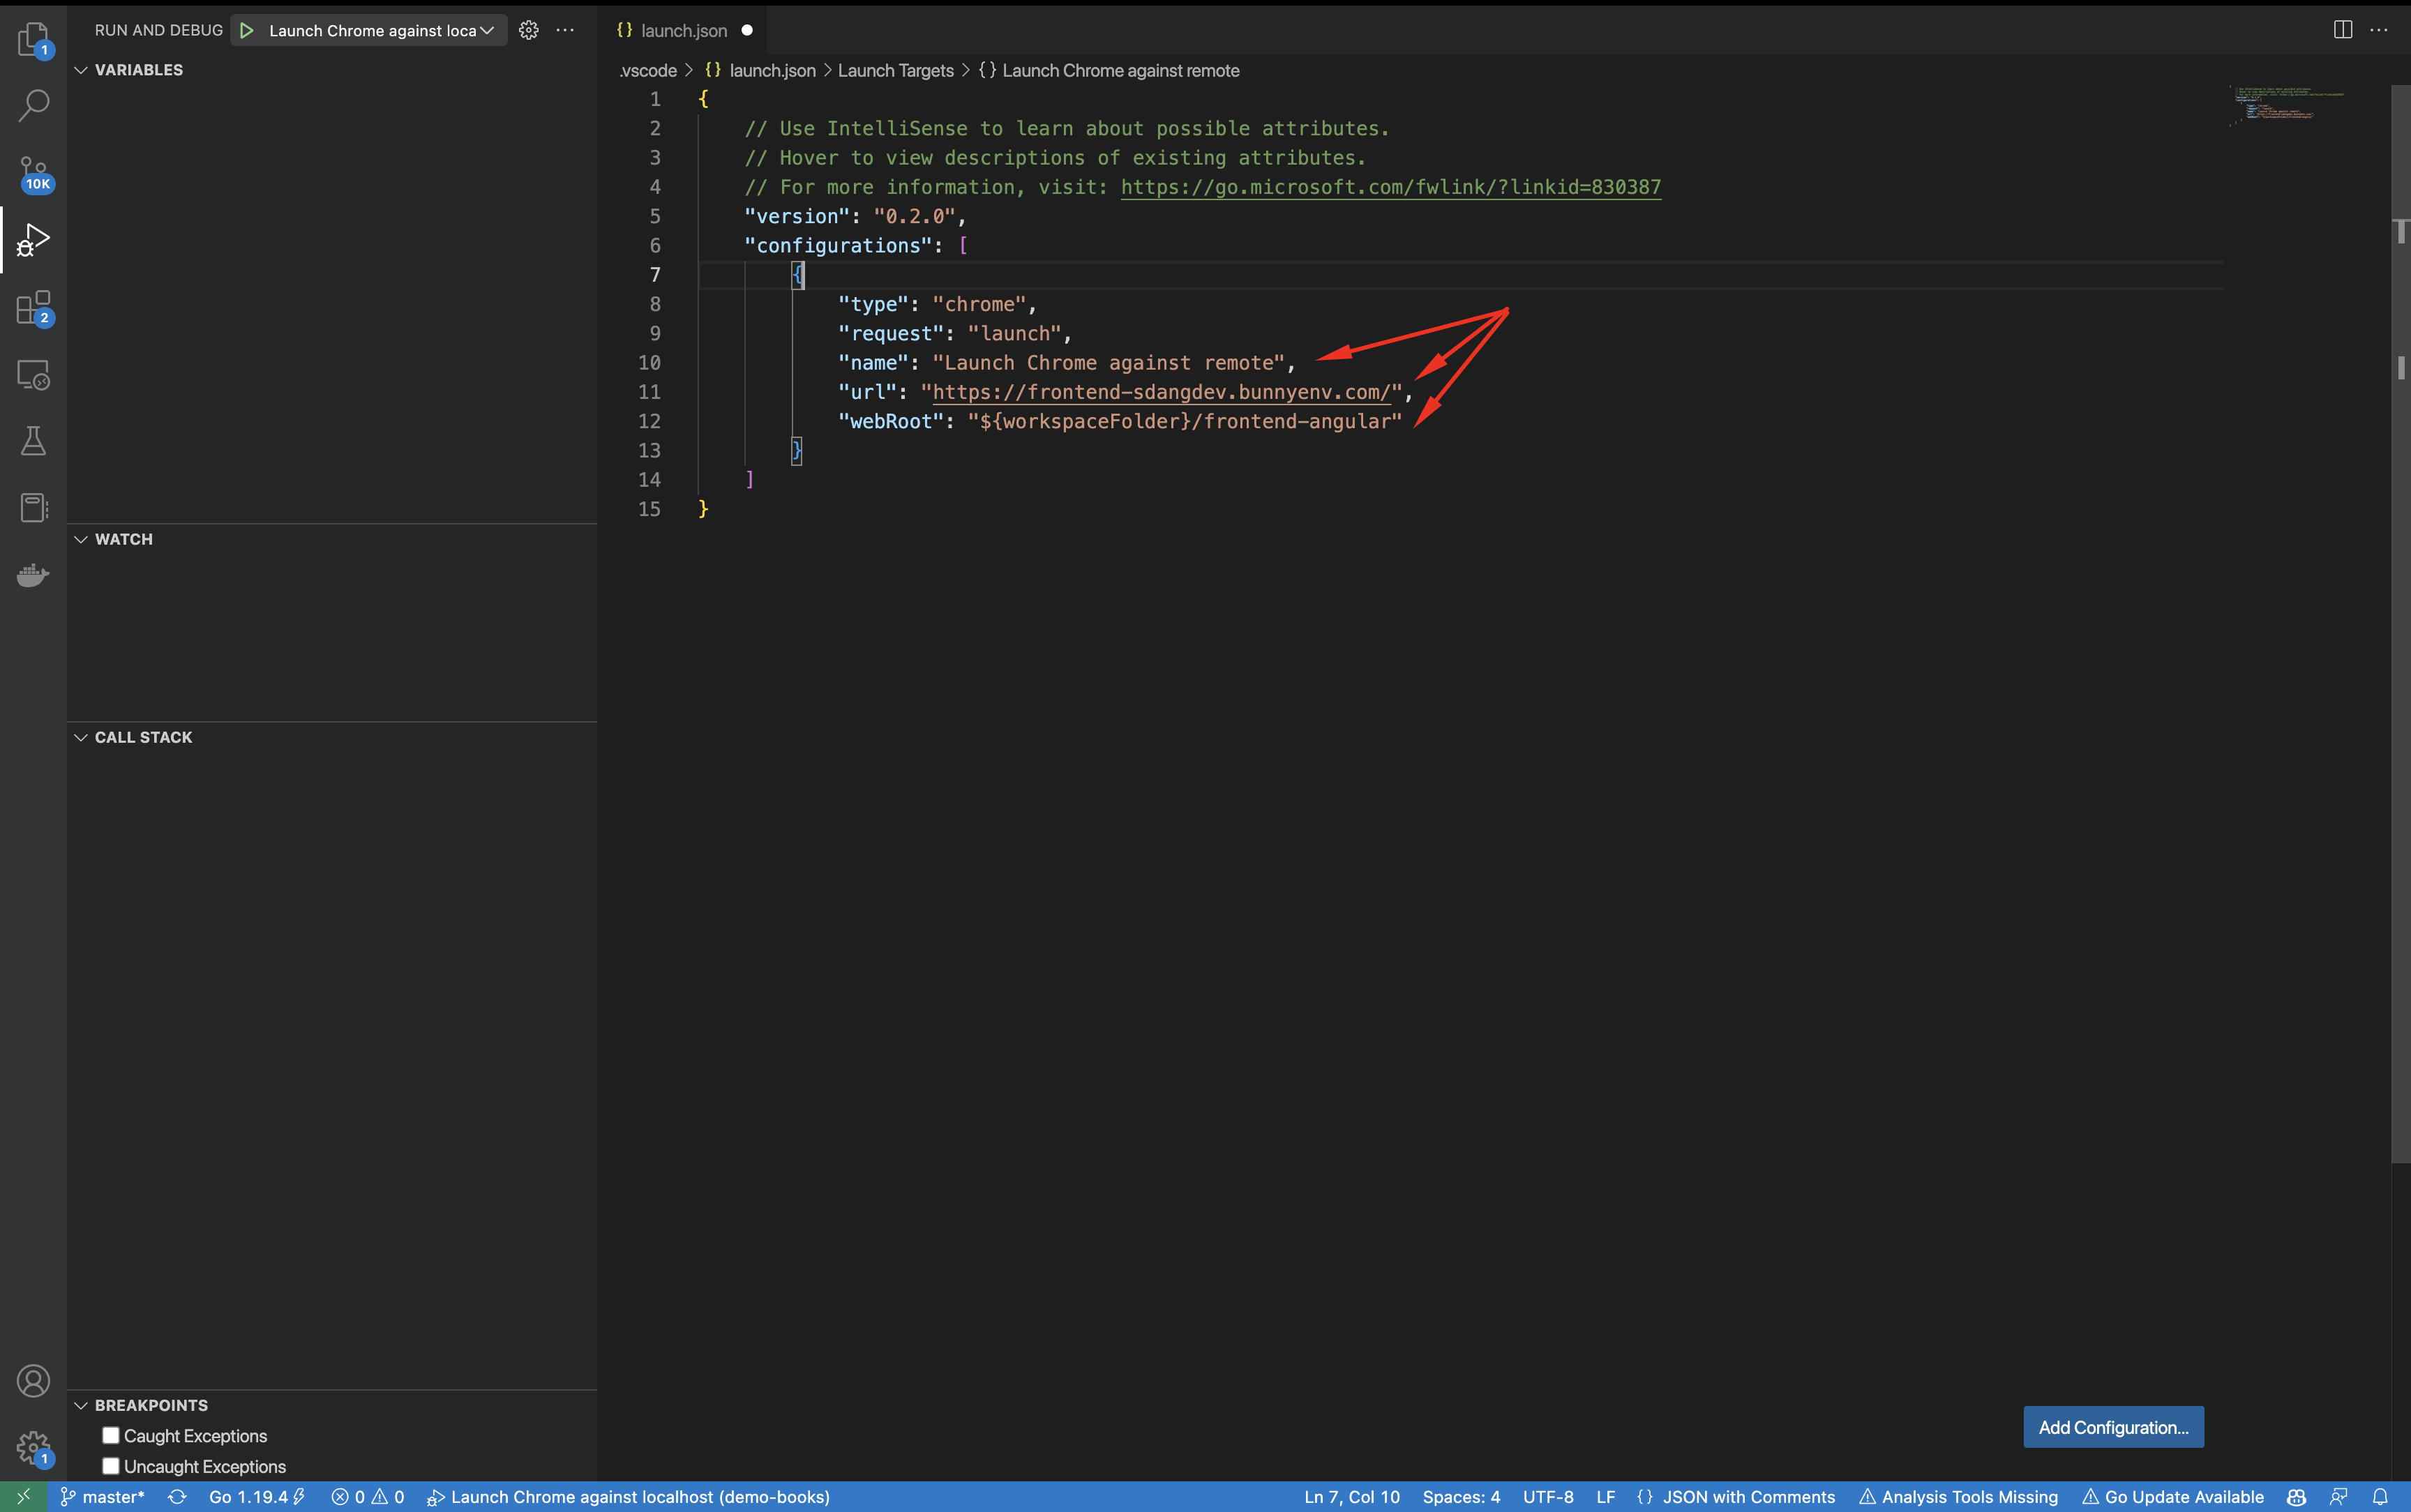
- Select Web App (Chrome) (or the one corresponding to the browser you're using).
- Change the name to fit your project, then paste in the
frontendURL in the url field, and adjust the webRoot to match the sub-folder of your project (if any) where the frontend application is located.
Debug your application
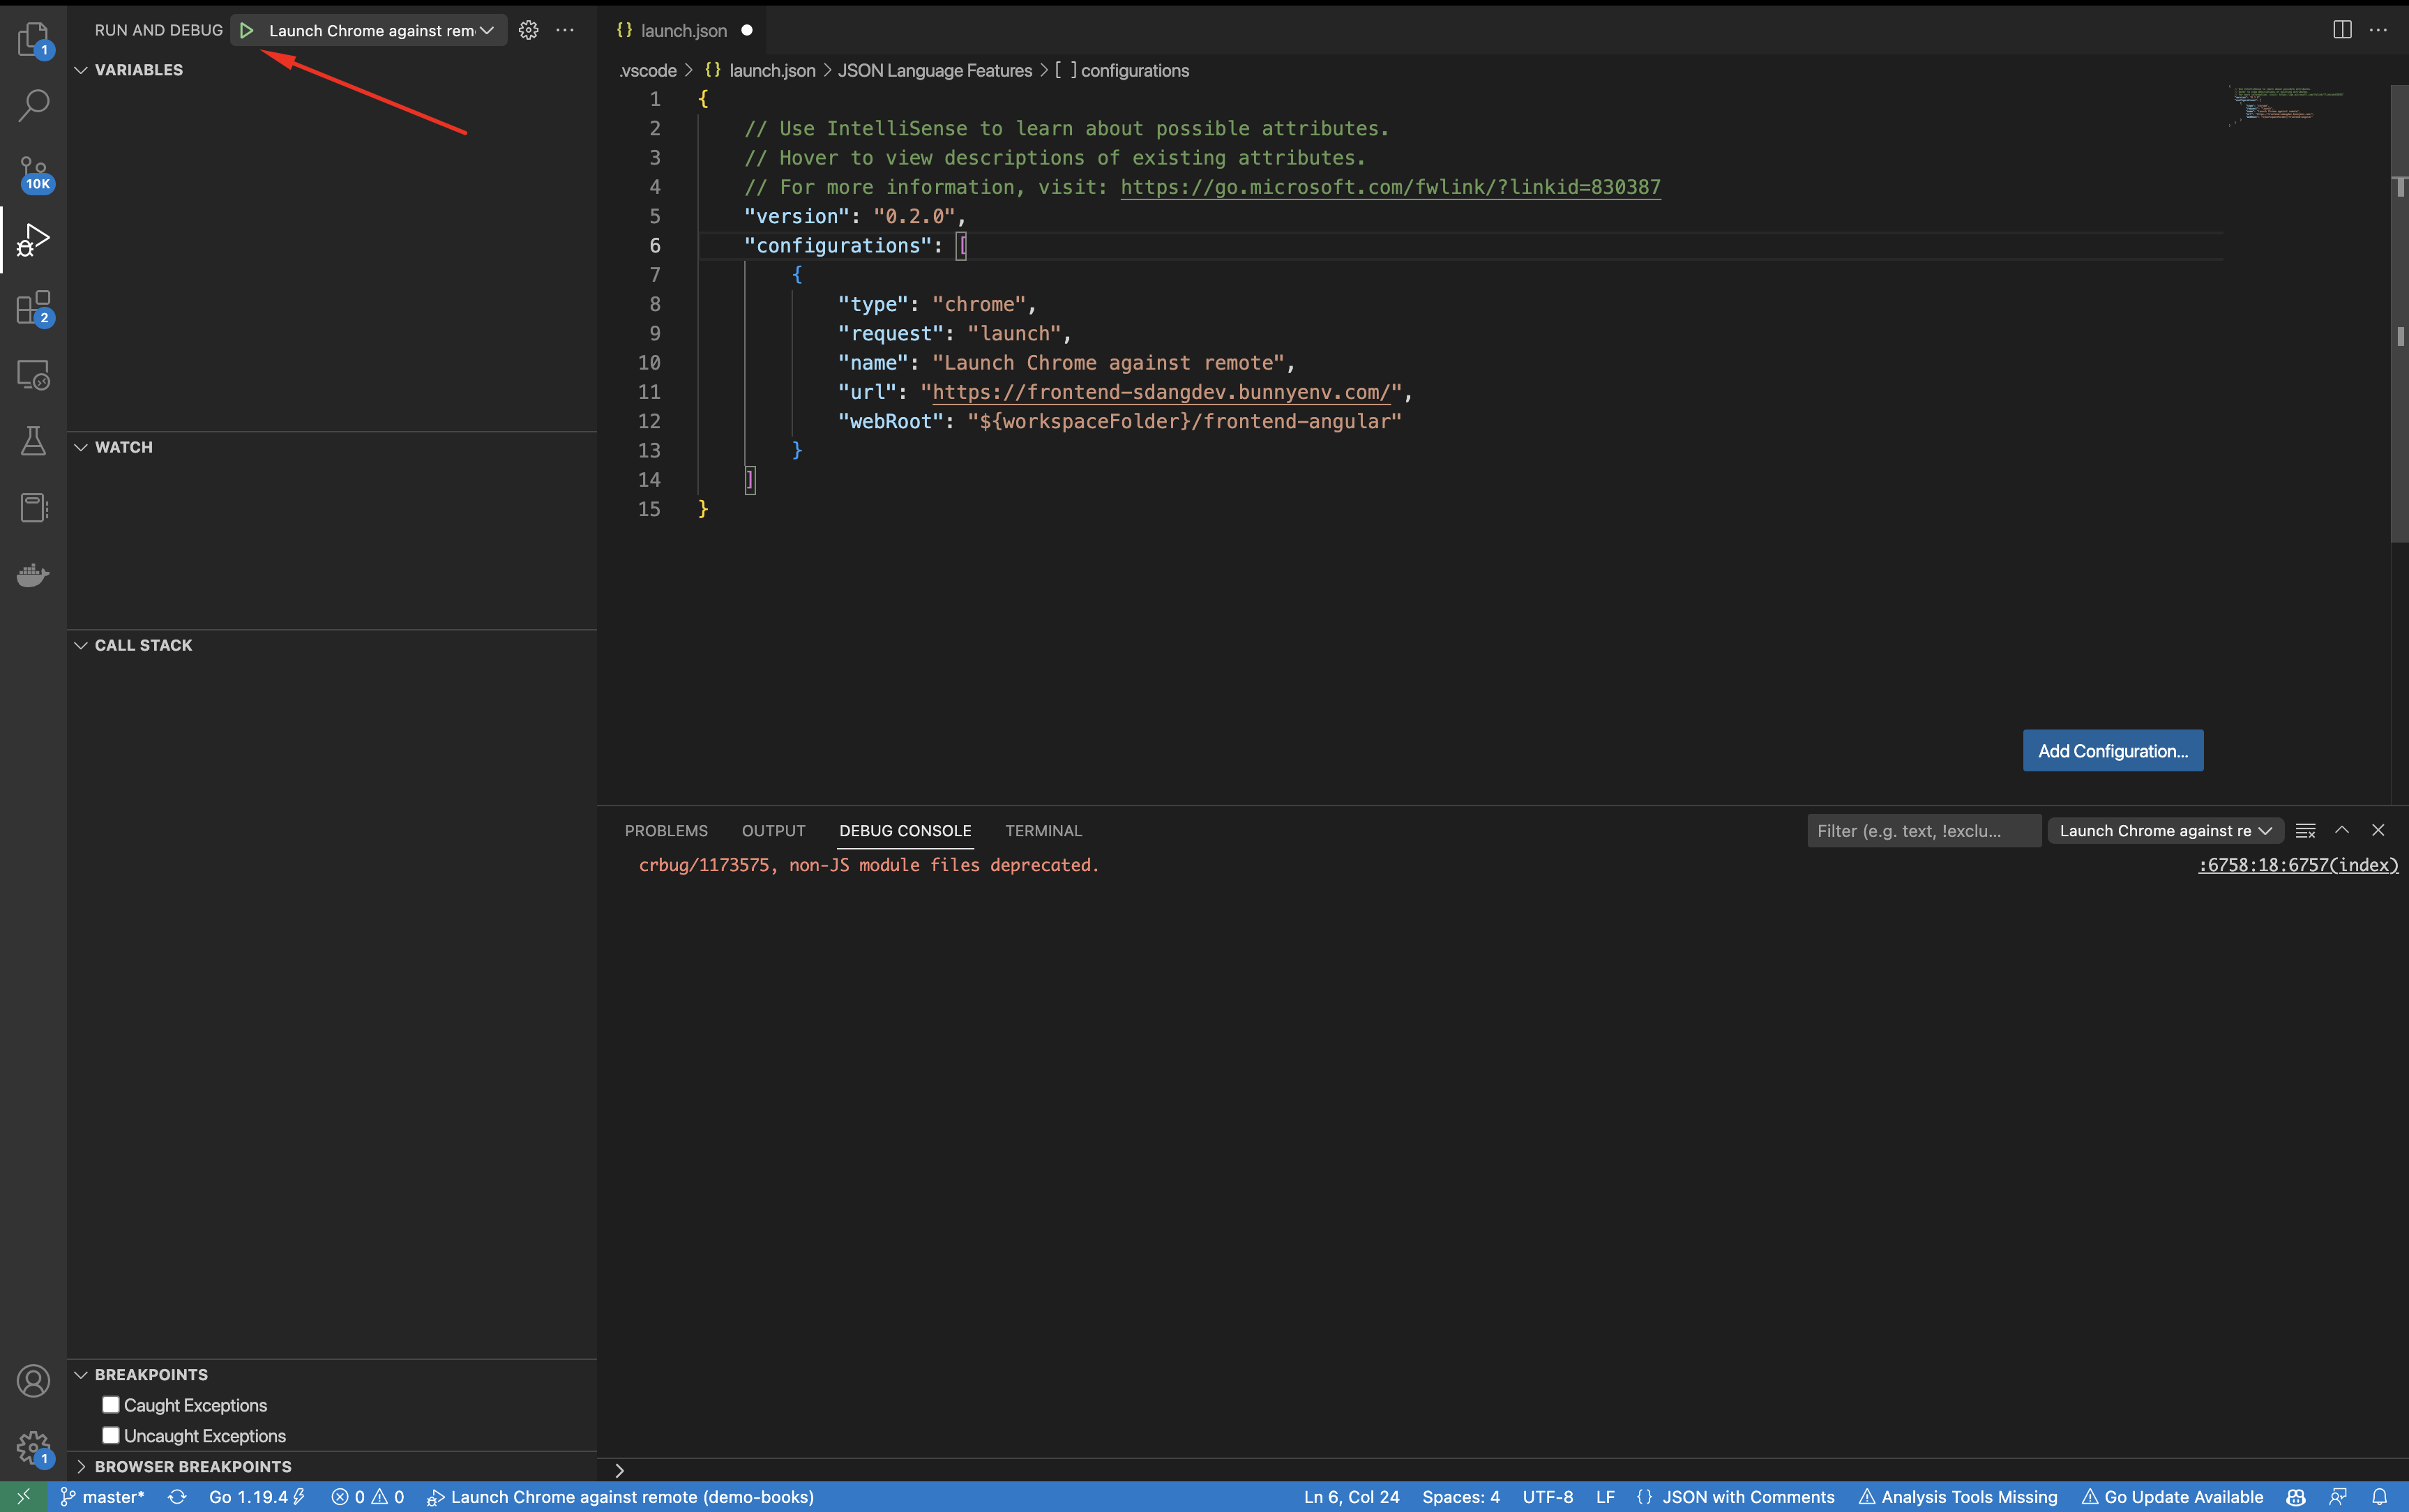
Finally, start the debugging session by going to the Debug panel on the left navigation menu, then select the configuration you just created and click the play button.
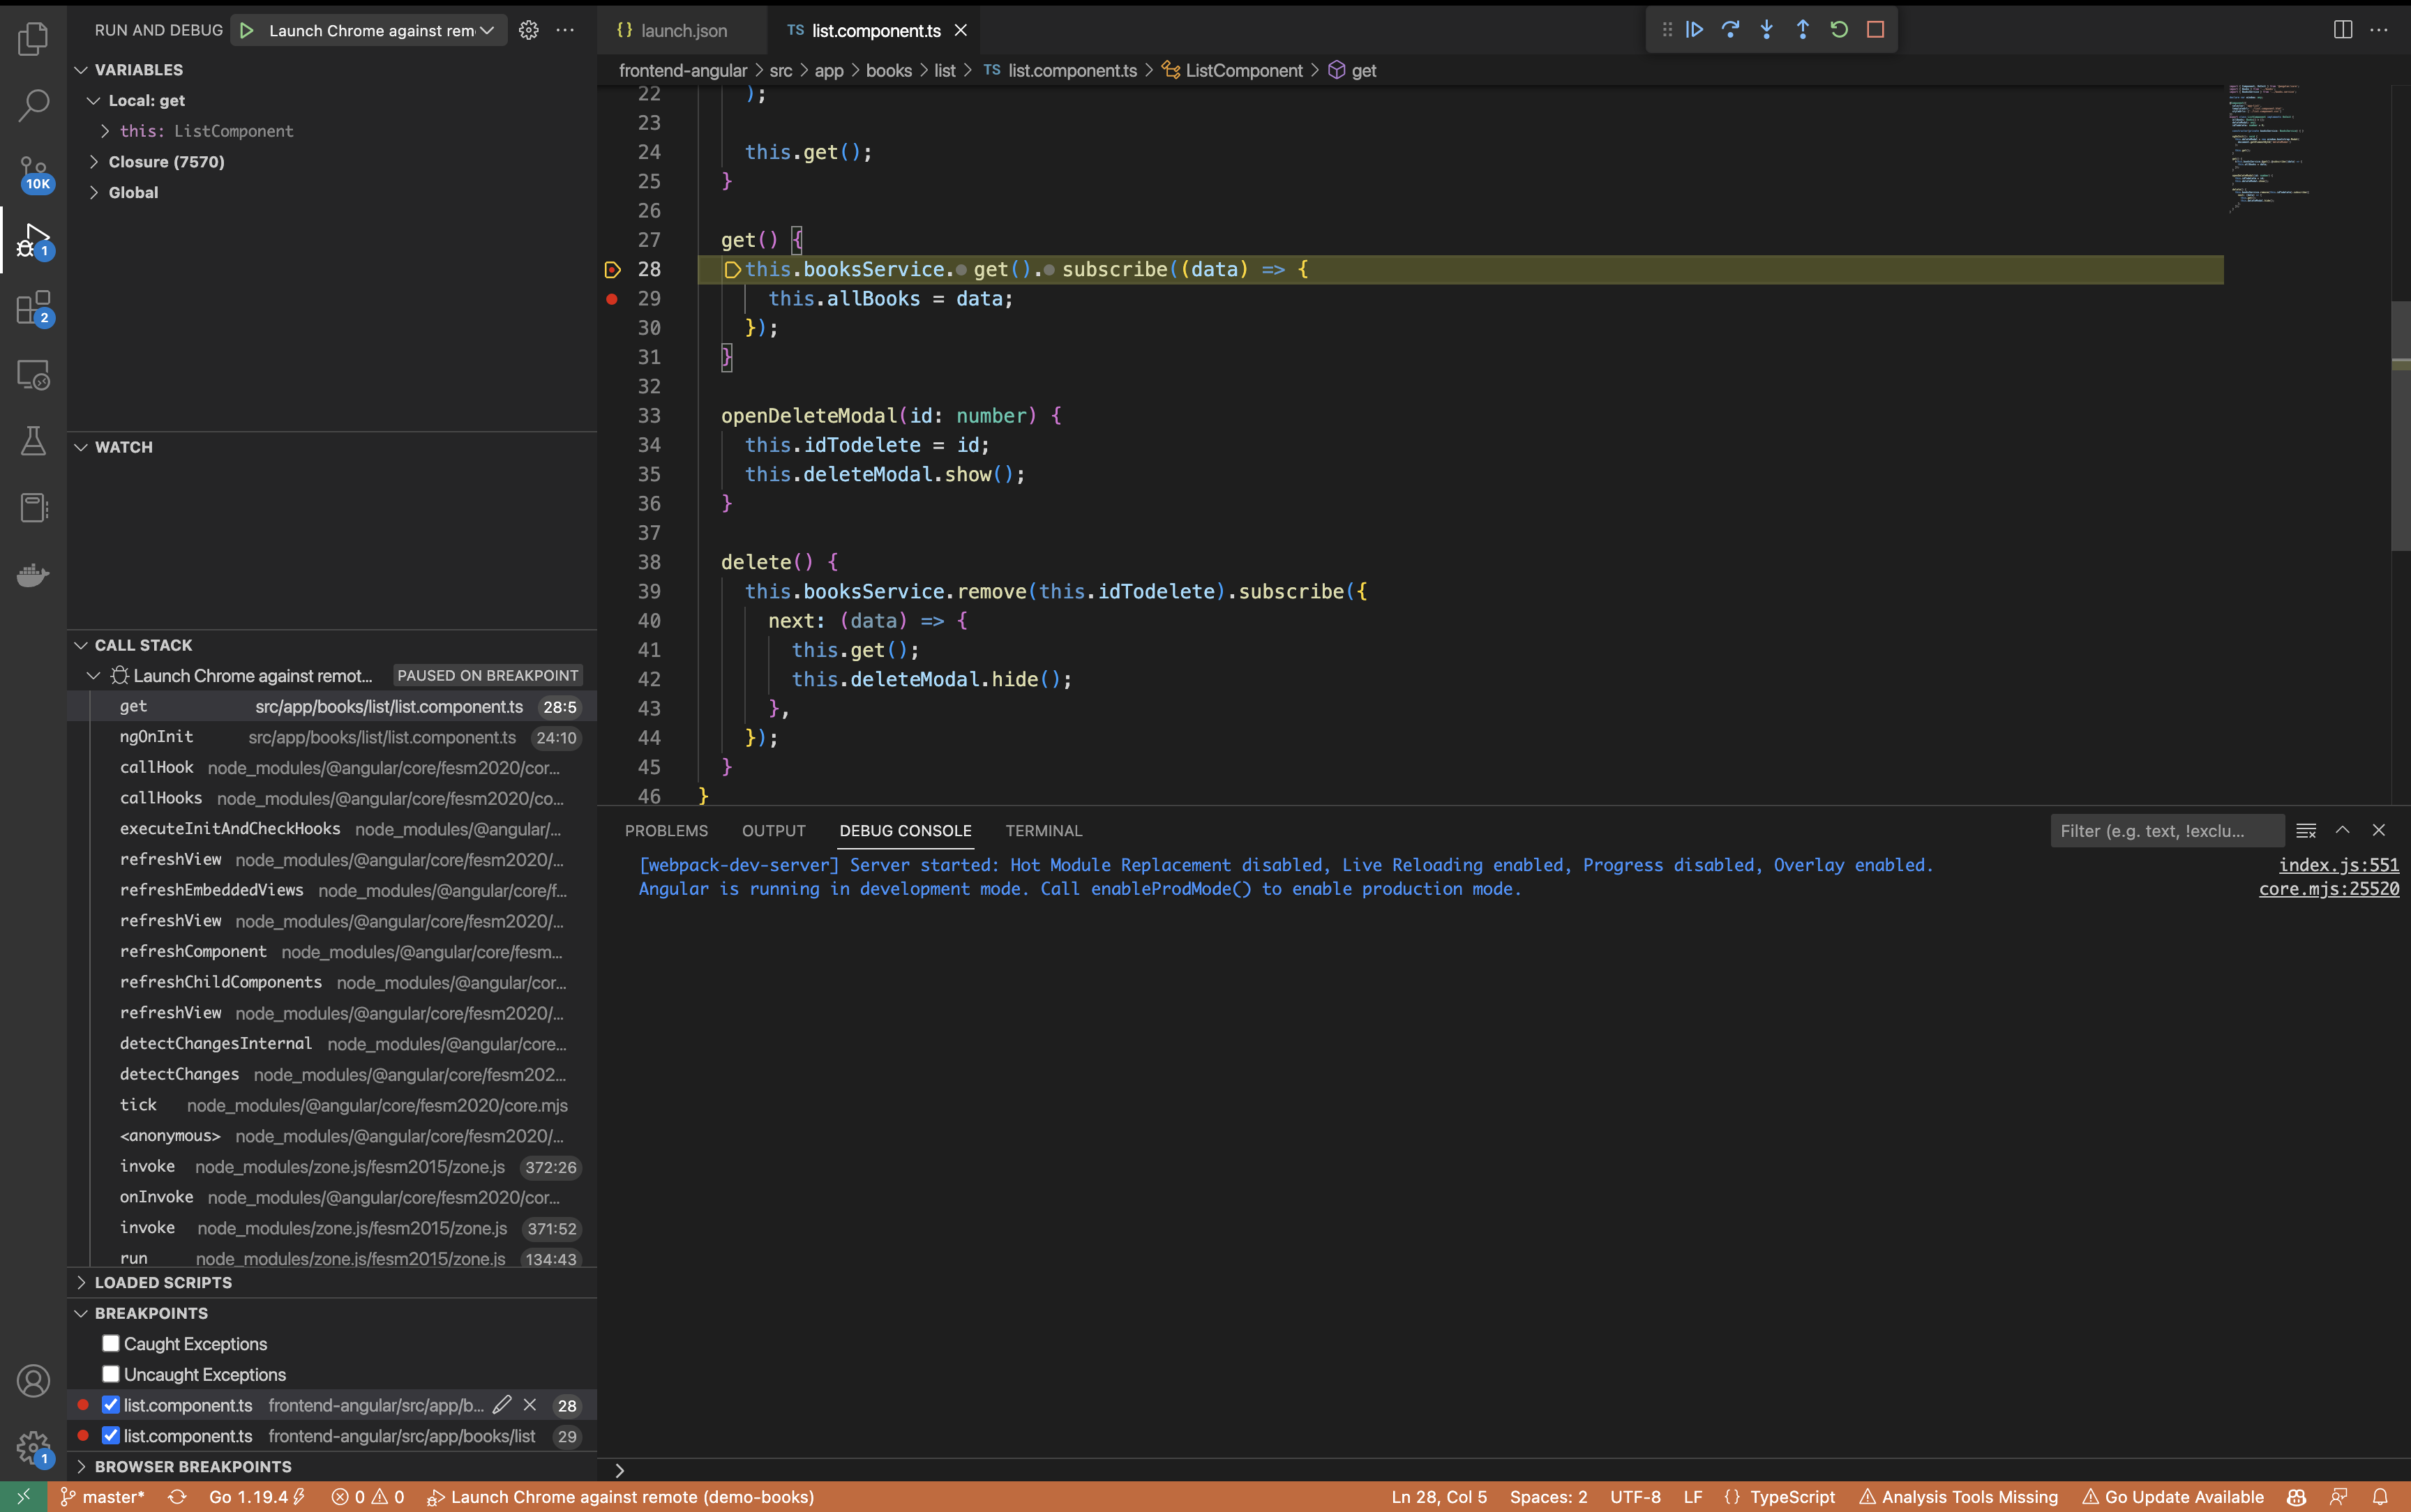
This will launch a new instance of your browser, ran with some additional arguments to allow debugging. Also, the new browser window will use a separate profile used for the session; this is a good thing, as it separates your workspace (including extensions) from it.
You can also configure Chrome to start by default in this debug mode and adjust your launch configuration's request toattachinstead oflaunch.
This will allow you to use the same Chrome window (on the same profile) you already have open.
For more information, please visit the dedicated VS Code documentation:
- https://code.visualstudio.com/docs/nodejs/browser-debugging
- https://code.visualstudio.com/docs/nodejs/reactjs-tutorial
- https://code.visualstudio.com/docs/nodejs/angular-tutorial
Happy debugging!
Updated 8 months ago
