Debugging node.js
Debugging frontend applications is different, so please check out the dedicated Debugging frontend apps section.
Port Forwarding for node.js
We chose an application using the popular tool nodemon and an IDE from the Jetbrains suite, but the process is similar for other debugging tools and IDEs.
Debugging node.js requires the debugger to connect to the node.js server, so a (forward) port forward will be required.
The default debugger port is 9229 and we have not changed it, but if you have configured it to something else, don't forget to replace it in all steps below.
For the example below we used the node.js application from our demo-books Quickstart Guide repository: https://github.com/bunnyshell/demo-books/tree/master/backend
Starting Remote Development
Step 1. Start remote development in Bunnyshell
You can start remote development and determine the Component using the built-in wizard, or you can specify it directly. Please see the start documentation for more details.
Since you need a port forwarding for the 9229 port, in Bunnyshell you would write the port forward as 9229>9229. Basically, you would need to run something similar to the command below, but replacing the Component ID with your own:
$ bns remote-development up --component RZmMRQX0kV --port-forward "9229>9229"The local path (the one on your machine) will be requested, as the source of the code sync. It is automatically pre-filled with the current folder.
$ bns remote-development up --component RZmMRQX0kV --port-forward "9229>9229"
? Local Path [tab for suggestions] (/Users/myuser/playground/demo-books/backend)
Then, you will need to provide the path within the container, which represents the target for the code sync.
$ bns remote-development up --component RZmMRQX0kV --port-forward "9229>9229"
? Local Path /Users/myuser/playground/demo-books/backend
? Remote Path
After providing it, Bunnyshell starts to perform the Remote Development changes within your cluster: a PersistentVolumeClaim is attached to your Pod and the container's command is changed, so you can have an SSH terminal (or more) into the container and ports forwarded, as well as for the file sync to happen.
$ bns remote-development up --component RZmMRQX0kV --port-forward "9229>9229"
? Local Path /Users/myuser/playground/demo-books/backend
? Remote Path /usr/src/app/backend
\ Waiting for pod to be ready
You can provide the local path and remote path also via command parameters, --local-sync-path (or -l) and --remote-sync-path (or -r).
After the Pod definition is changed, you will be having access to the container itself through and SSH shell.
$ bns remote-development up --component RZmMRQX0kV --port-forward "9229>9229"
? Local Path /Users/myuser/playground/demo-books/backend
? Remote Path /usr/src/app/backend
/usr/src/app/backend #
Once you're in, you need to start the node.js process with debugging capabilities, so you need to include the --inspect flag. For us, this means running the npm run start:dev command, since we have it defined in the scripts section of package.json, but you could just as well run the nodemon --inspect server.js command.
...
    "scripts": {
        "start": "node server.js",
        "start:dev": "nodemon --inspect server.js"
    },
So, to conclude, just run:
$ bns remote-development up --component RZmMRQX0kV --port-forward "9229>9229"
? Local Path /Users/myuser/playground/demo-books/backend
? Remote Path /usr/src/app/backend
/usr/src/app/backend # npm run start:dev
You will see the output of the command, which will confirm that the debugger is listening on port 9229
$ bns remote-development up --component RZmMRQX0kV --port-forward "9229>9229"
? Local Path /Users/myuser/playground/demo-books/backend
? Remote Path /usr/src/app/backend
/usr/src/app/backend # npm run start:dev

> [email protected] start:dev
> nodemon --inspect server.js

[nodemon] 2.0.20
[nodemon] to restart at any time, enter `rs`
[nodemon] watching path(s): *.*
[nodemon] watching extensions: js,mjs,json
[nodemon] starting `node --inspect server.js`
Debugger listening on ws://127.0.0.1:9229/15efac56-c993-4473-8d1e-502f5c98d59c
For help, see: https://nodejs.org/en/docs/inspector
Server is running on port 3080.
Executing (default): CREATE TABLE IF NOT EXISTS "books" ("id"   SERIAL , "title" VARCHAR(255), "description" VARCHAR(255), "available" BOOLEAN, "createdAt" TIMESTAMP WITH TIME ZONE NOT NULL, "updatedAt" TIMESTAMP WITH TIME ZONE NOT NULL, PRIMARY KEY ("id"));
...
Setting up the IDE
The information is also available in the JetBrains Documentation.
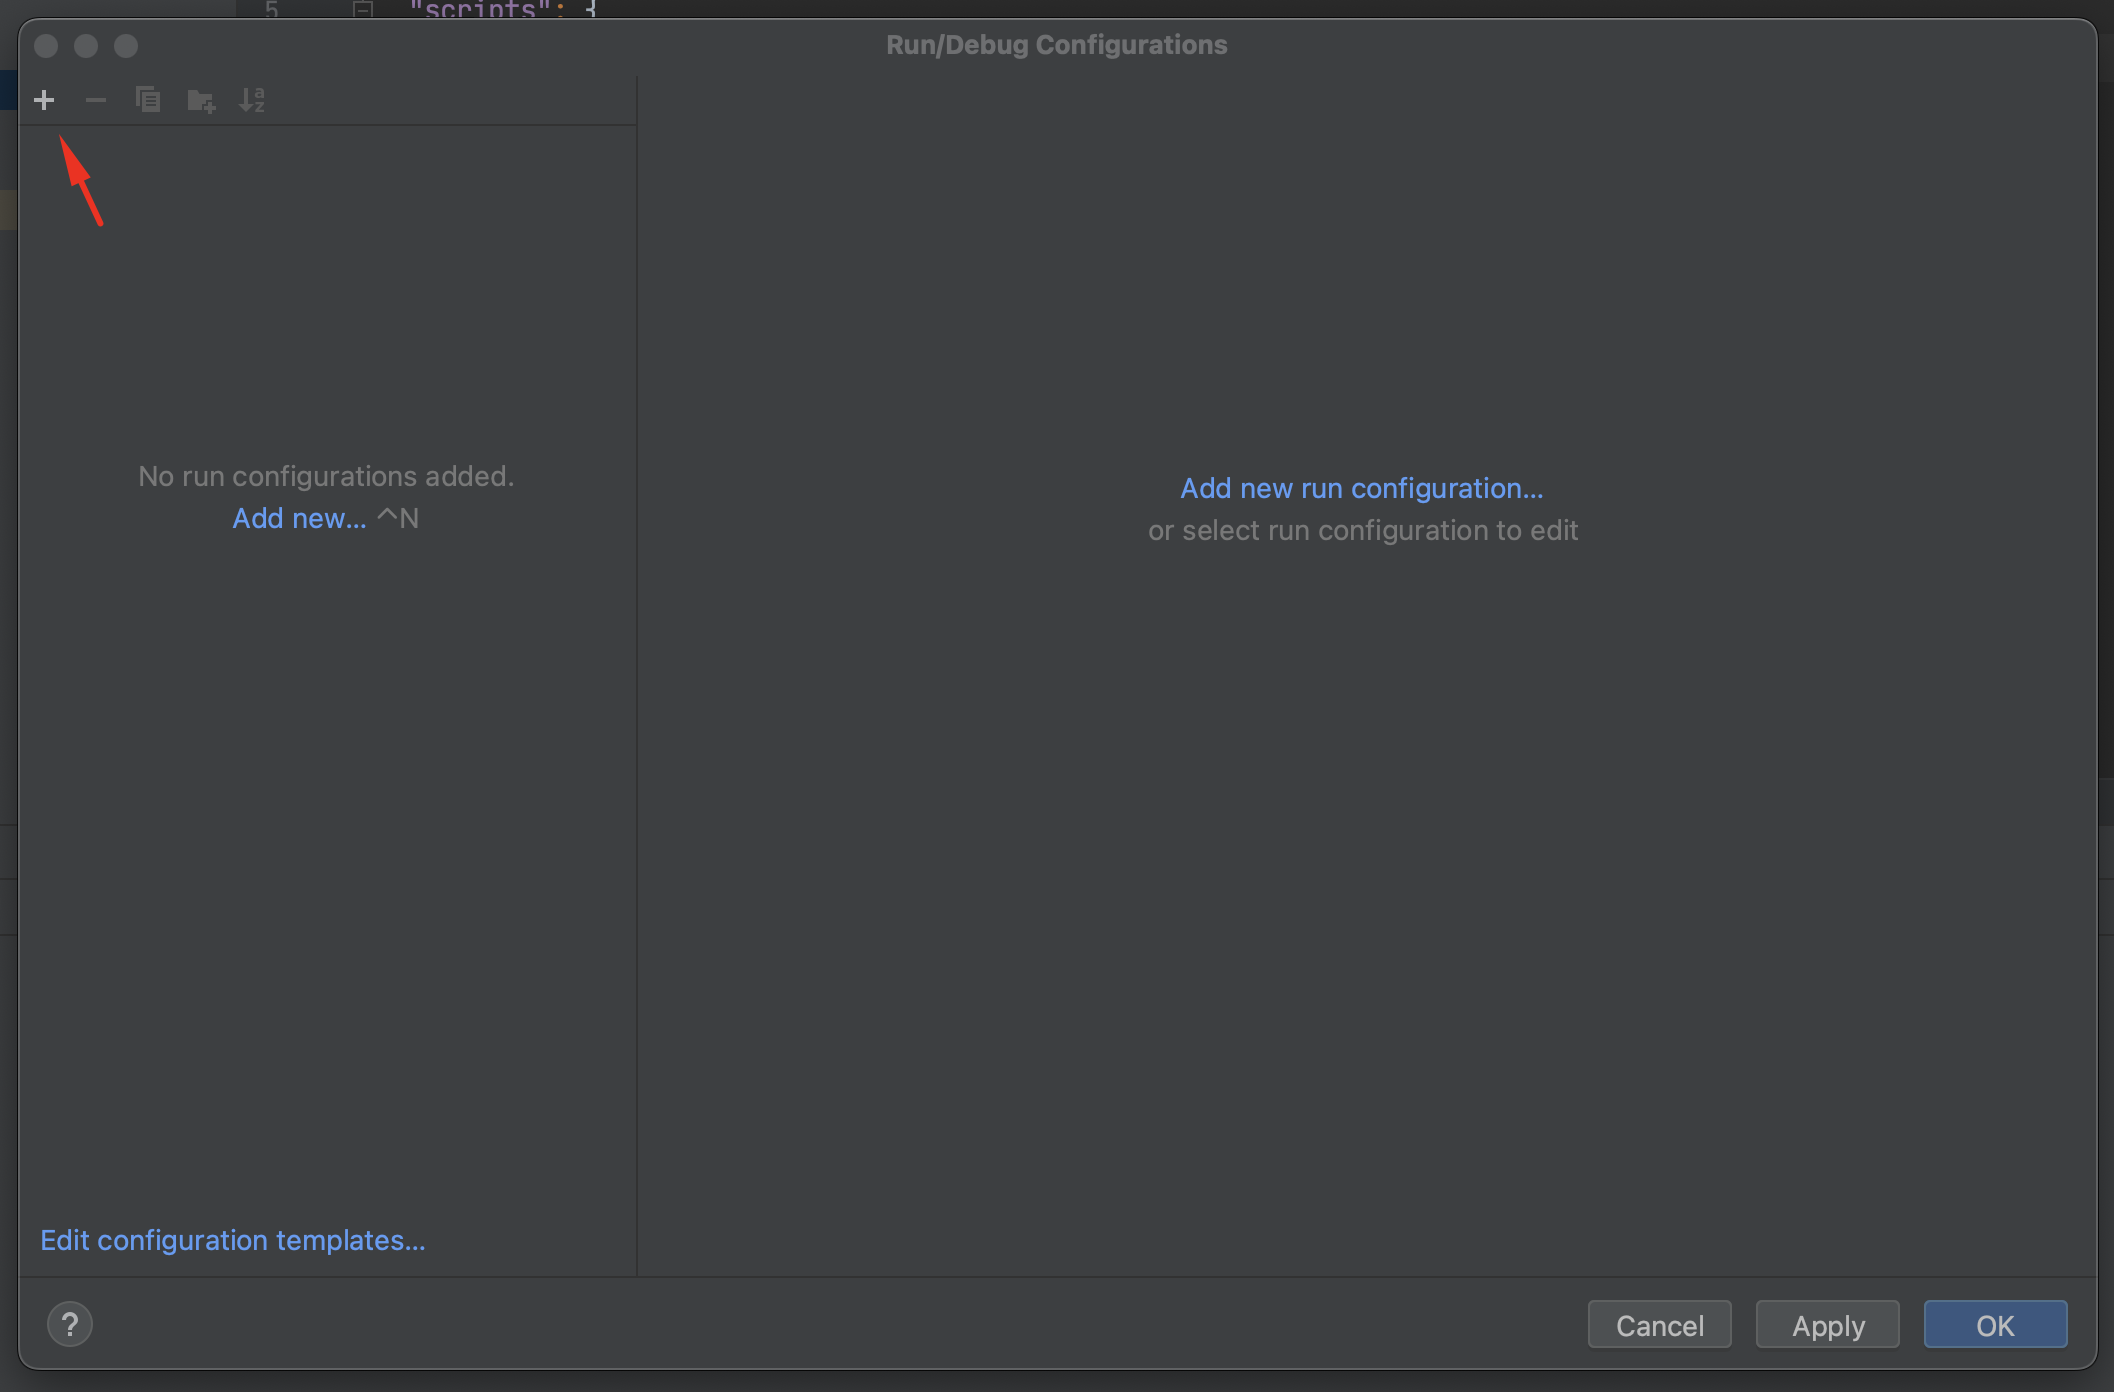
From any Jetbrains IDE (such as IntelliJ / Webstorm / PhpStorm) menu, you would go to Run → Edit Configurations, then click on the + button to add a new configuration.
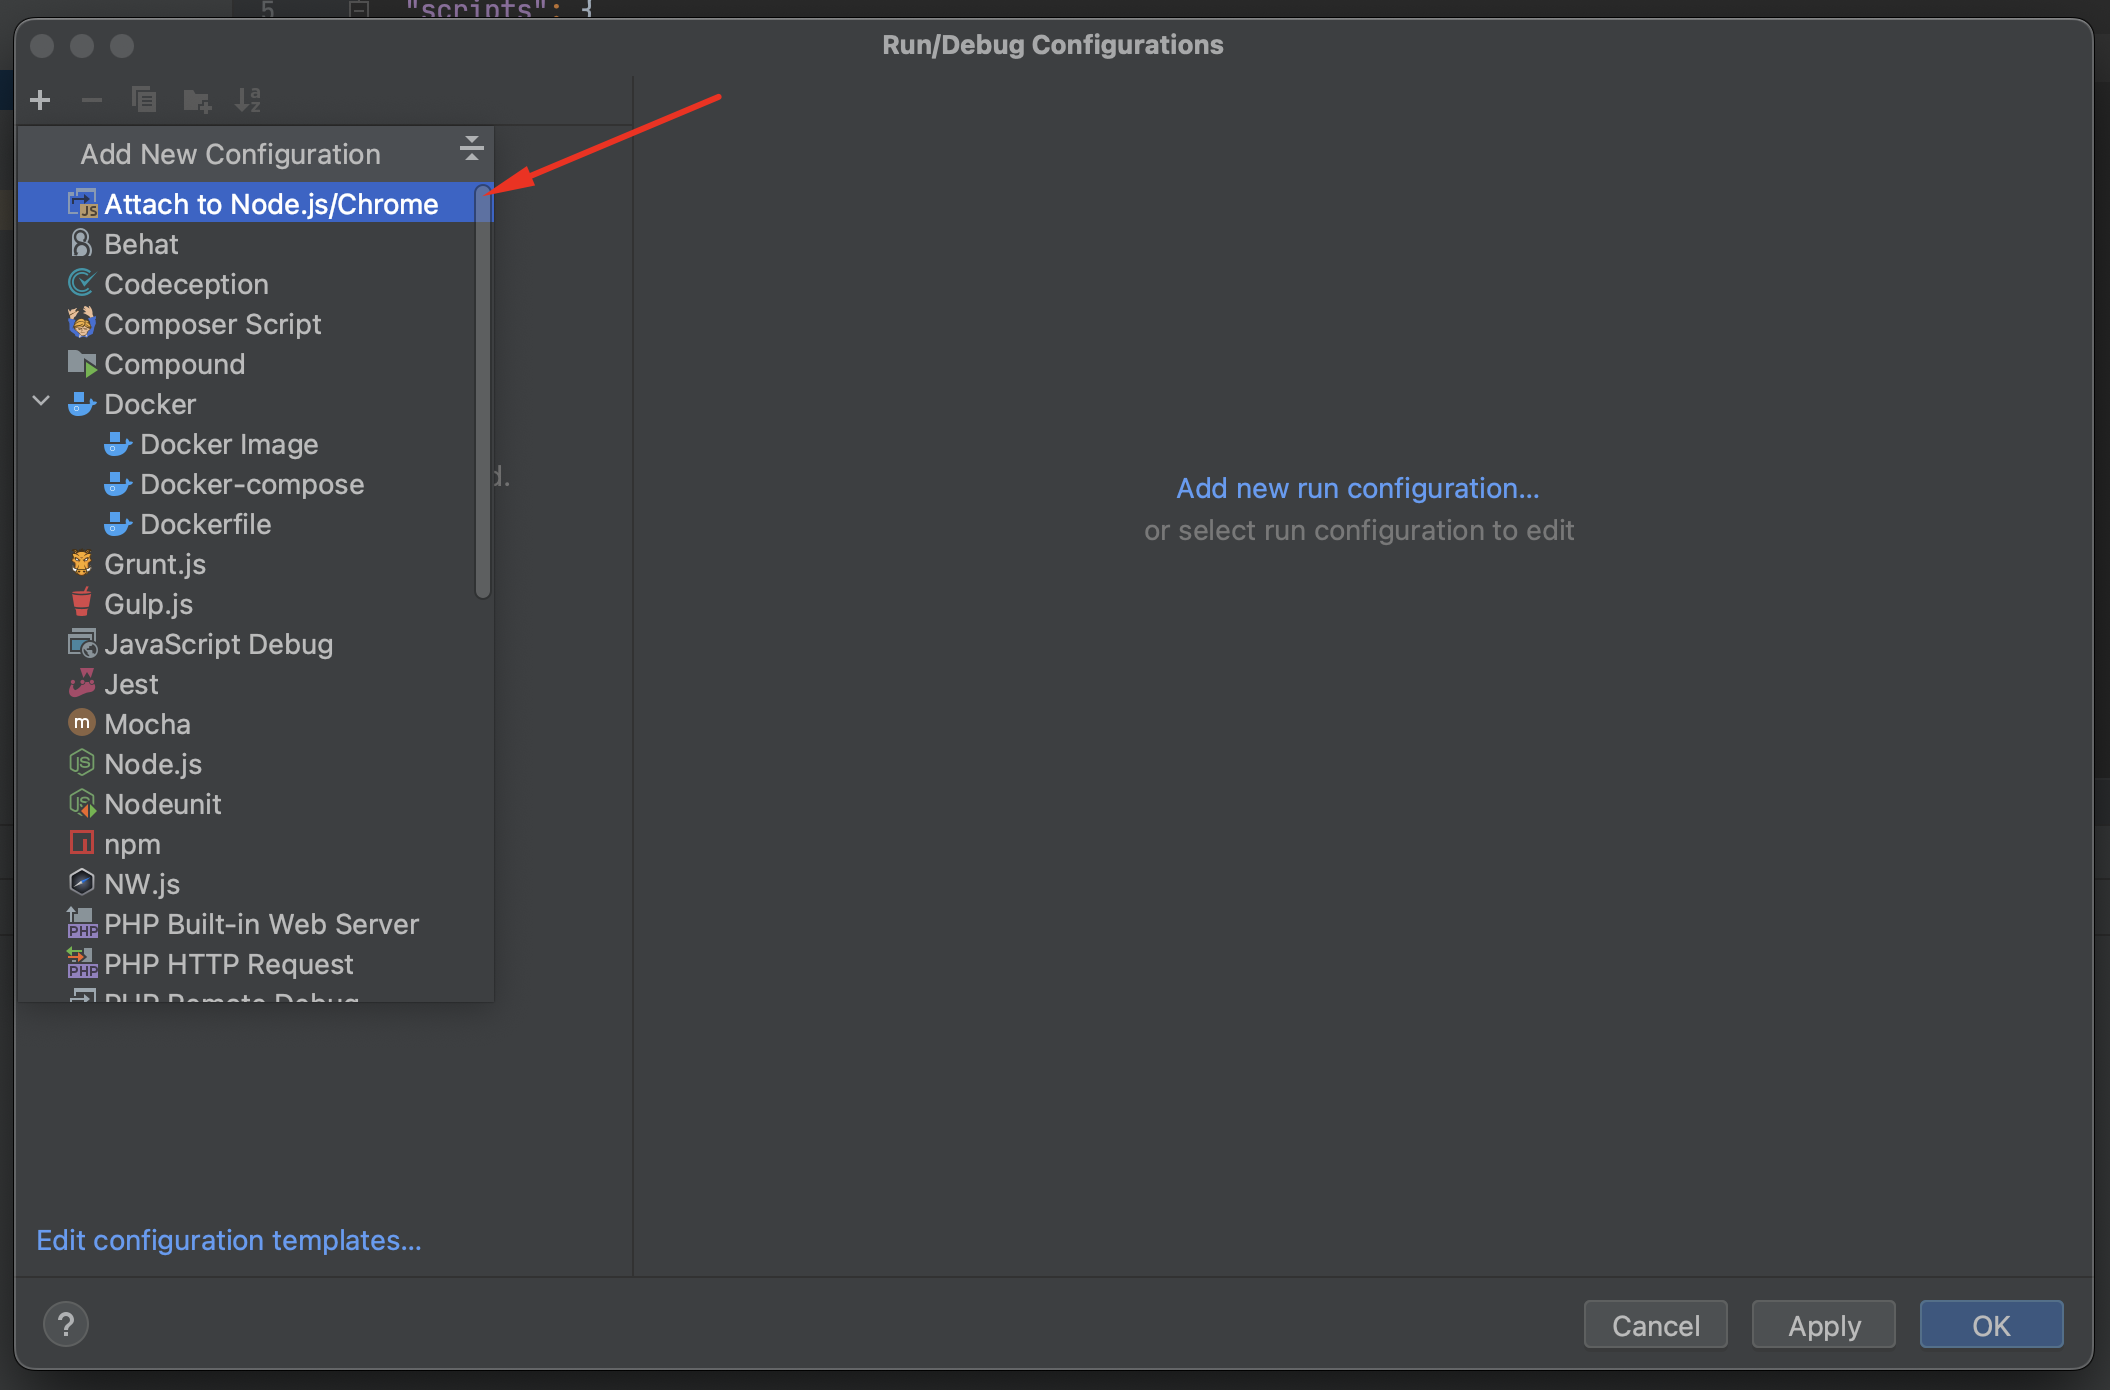
Then, choose Attach to Node.js/Chrome.
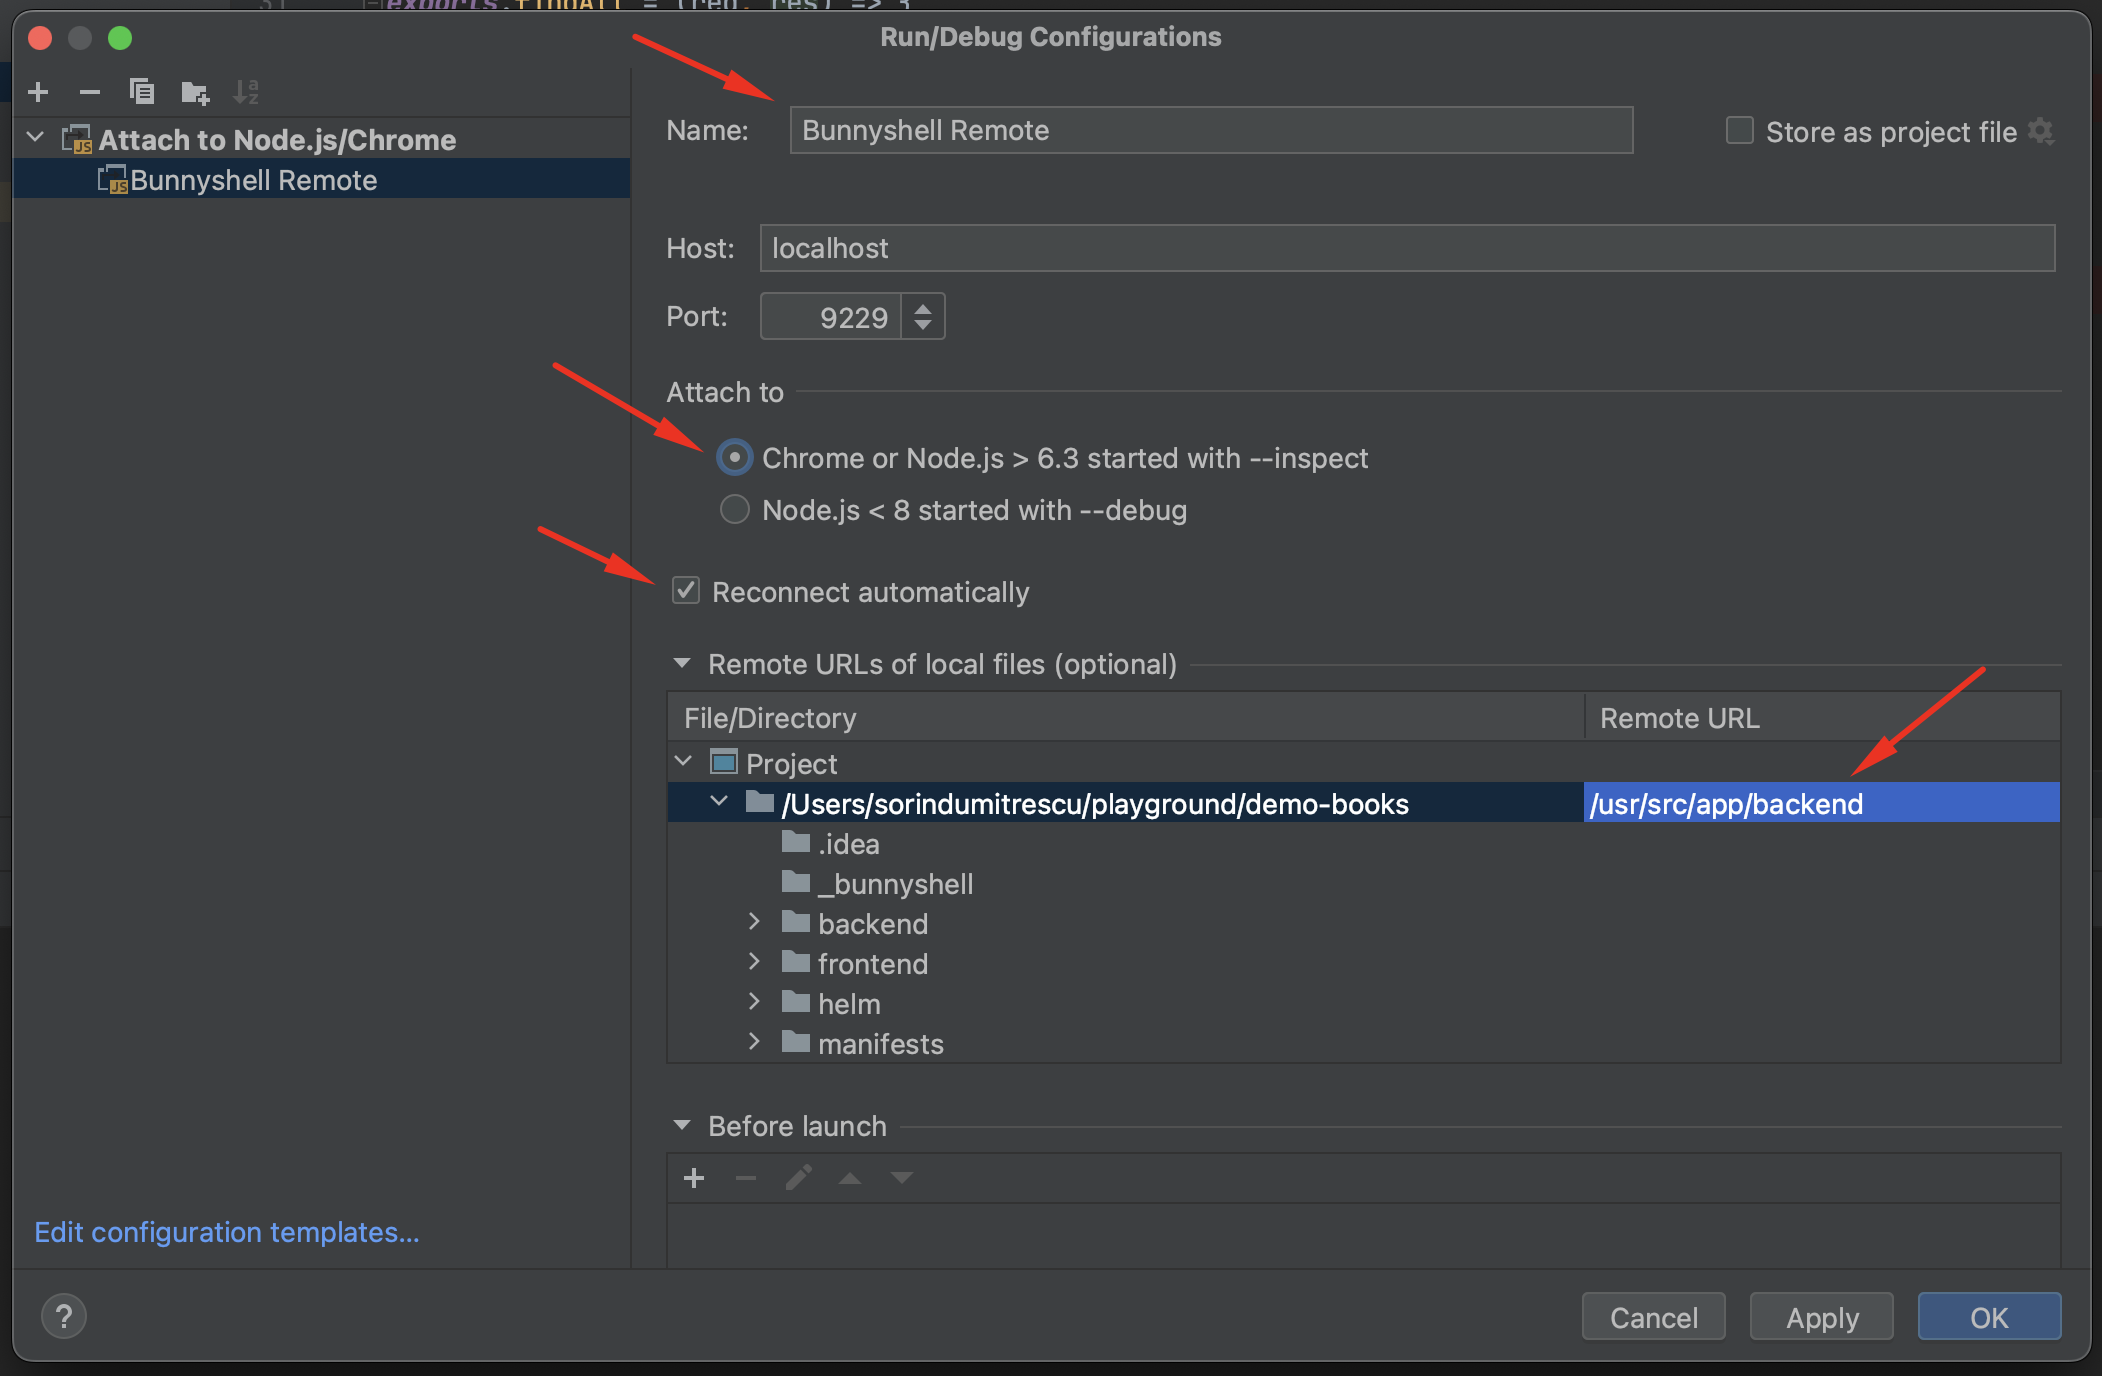
Name your configuration, make sure that the port is the correct one (if you changed it), then you need to make sure that Chrome or Node.js > 6.3 started with --inspect option is selected, and that the Reconnect automatically option is checked (so when reloading the app due to file changes you will still be able to debug).
Lastly, make sure that the folder mapping is correct, by entering the container folder in the Remote URL field, at the project folder level. Then click OK.
To start the remote debugging process, select the configuration and hit the bug icon, Debug.
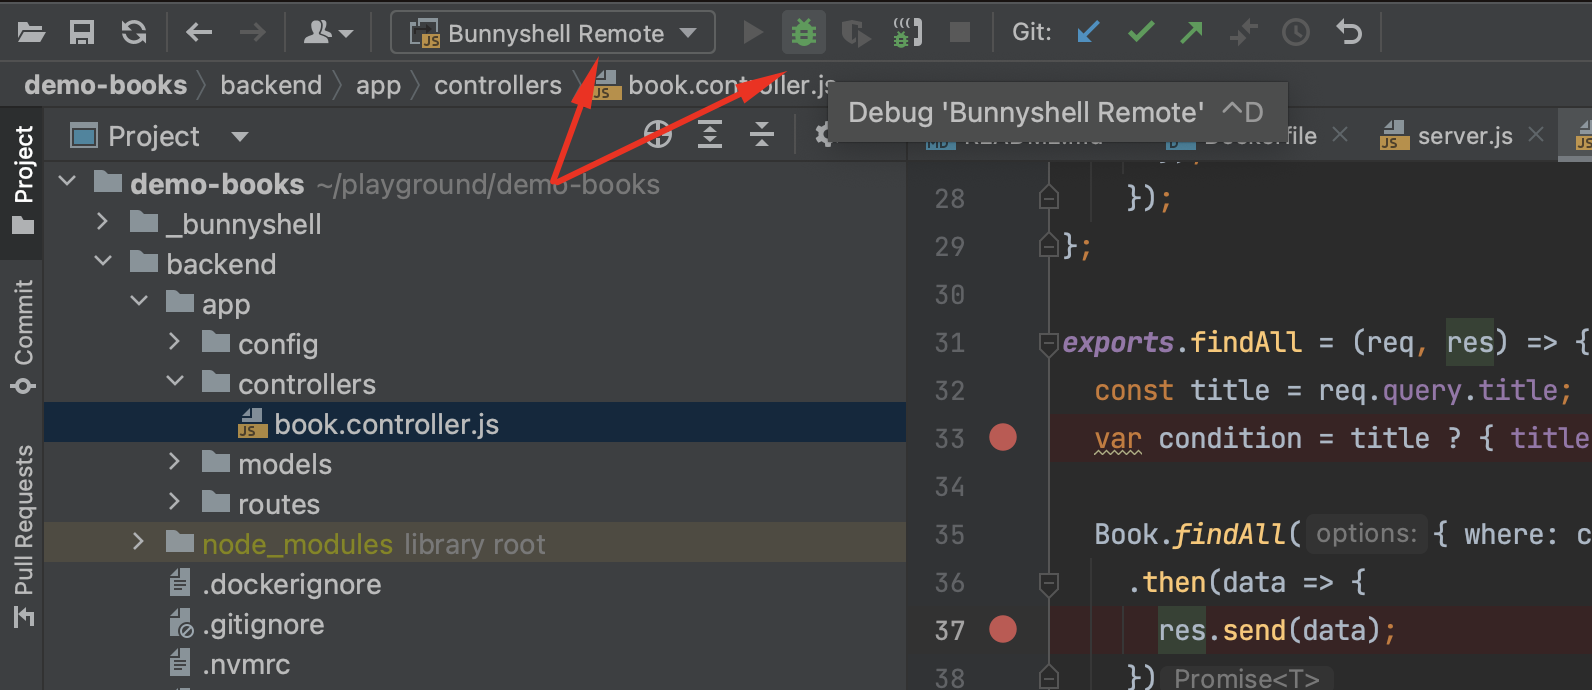
Alternately, you can do this also from the Run menu, by selecting the option to debug the added configuration.
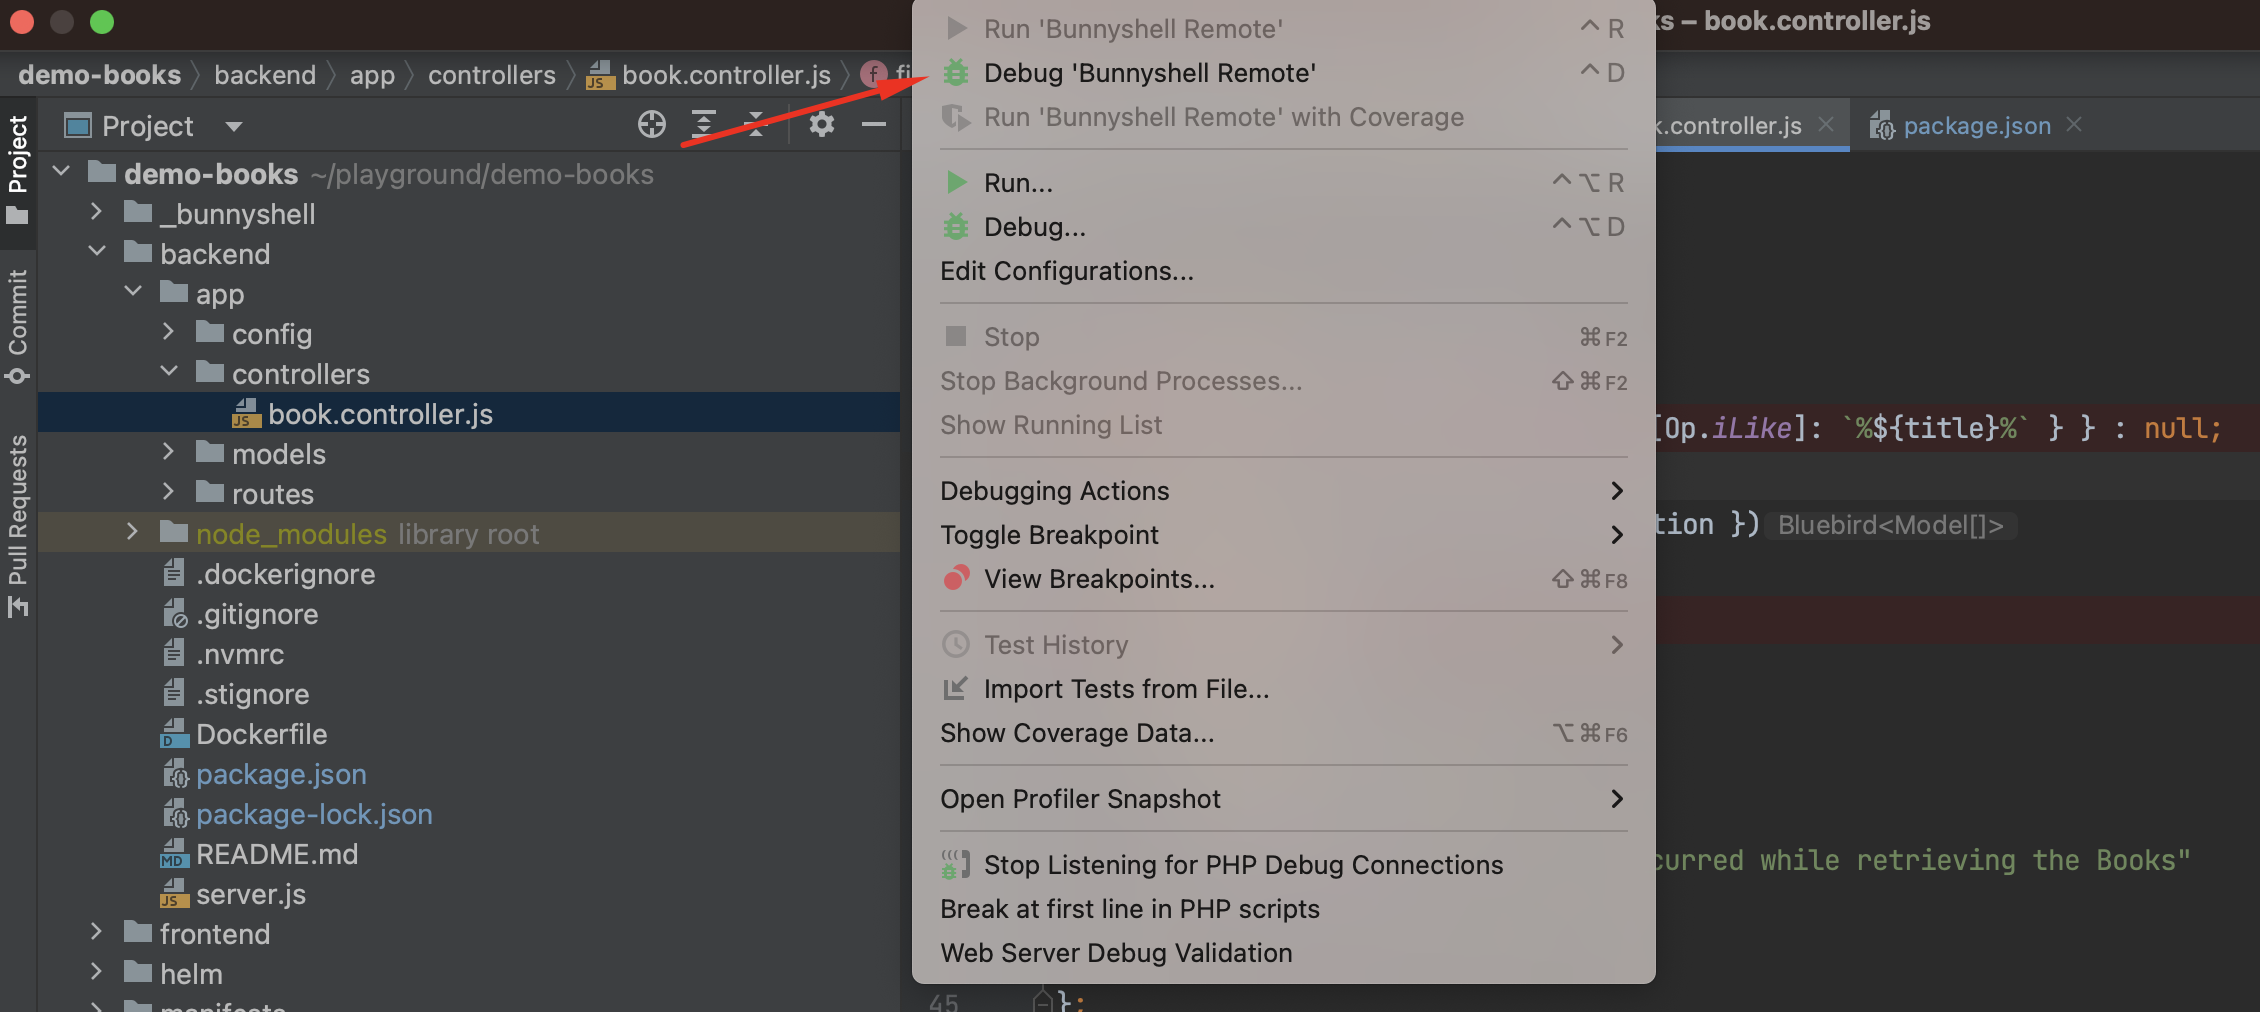
Congratulations! You are now able to remote debug your applications.
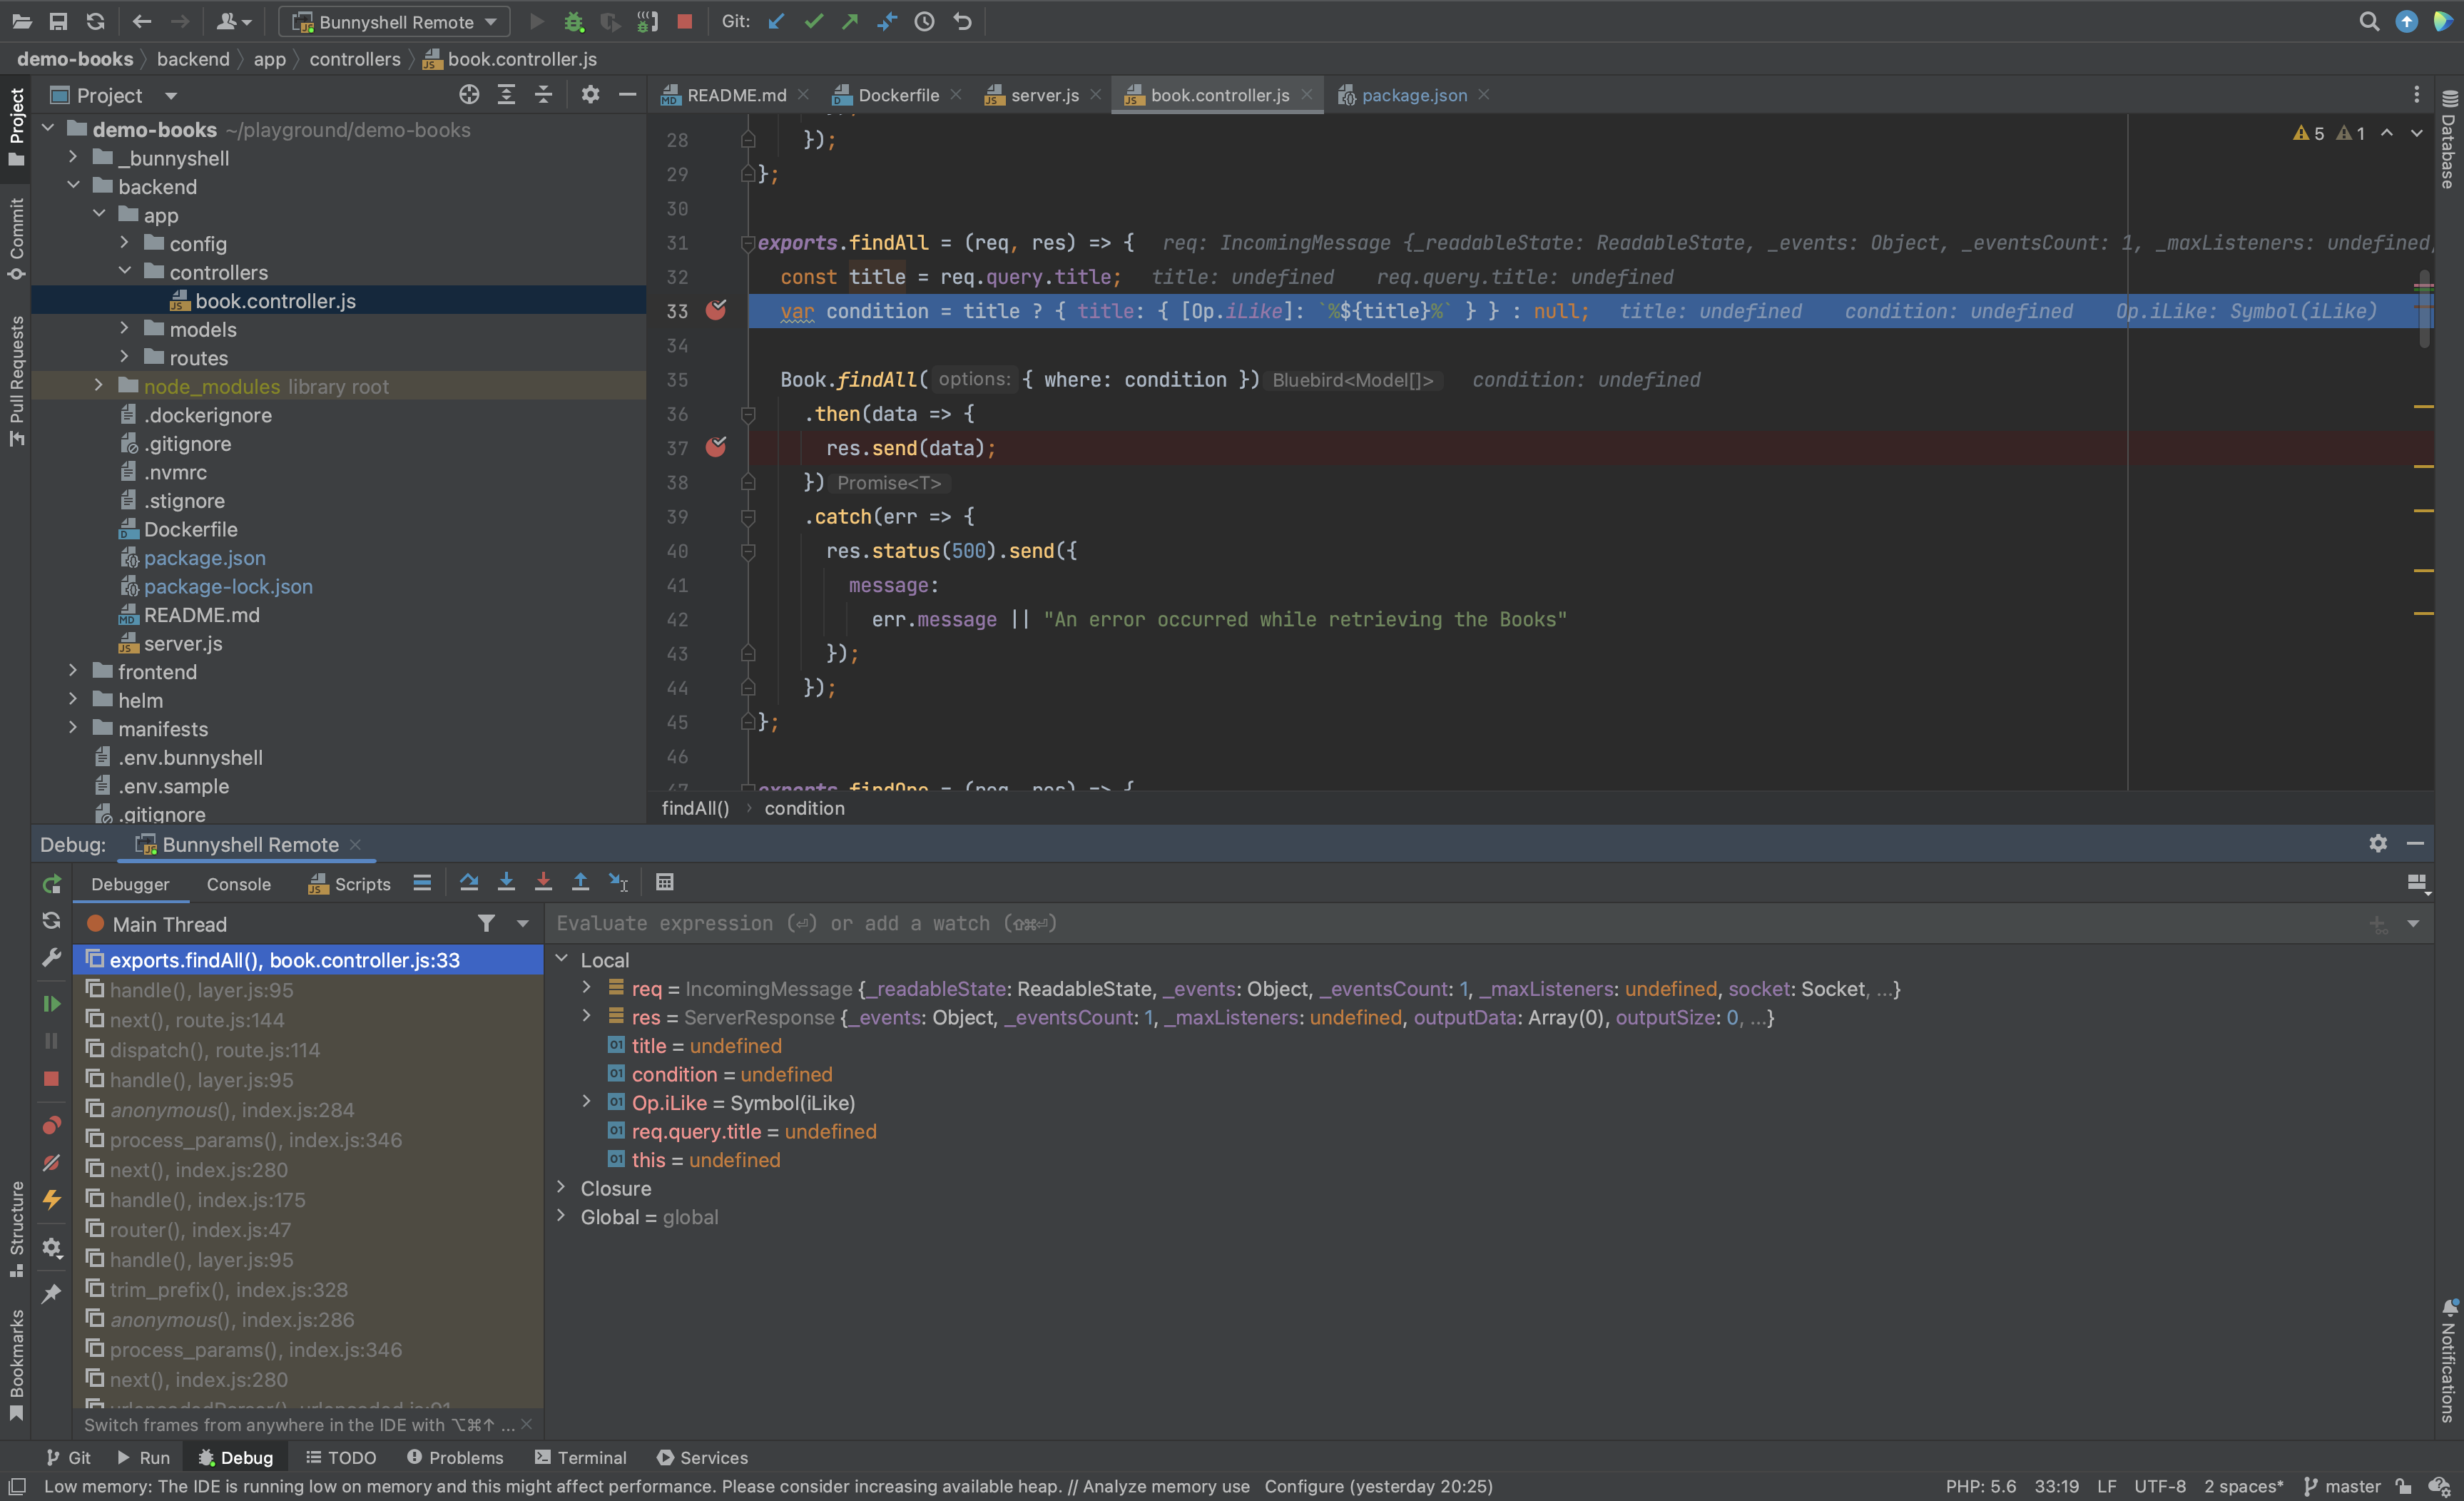
Congratulations! You are now able to debug node.js applications remotely.
Updated 8 months ago
