Debug Java
Pre-requisites
By default, the JVM doesn't enable debugging. This is because debugging creates additional overhead inside the JVM. It can also be a security concern for applications that are publicly accessible.
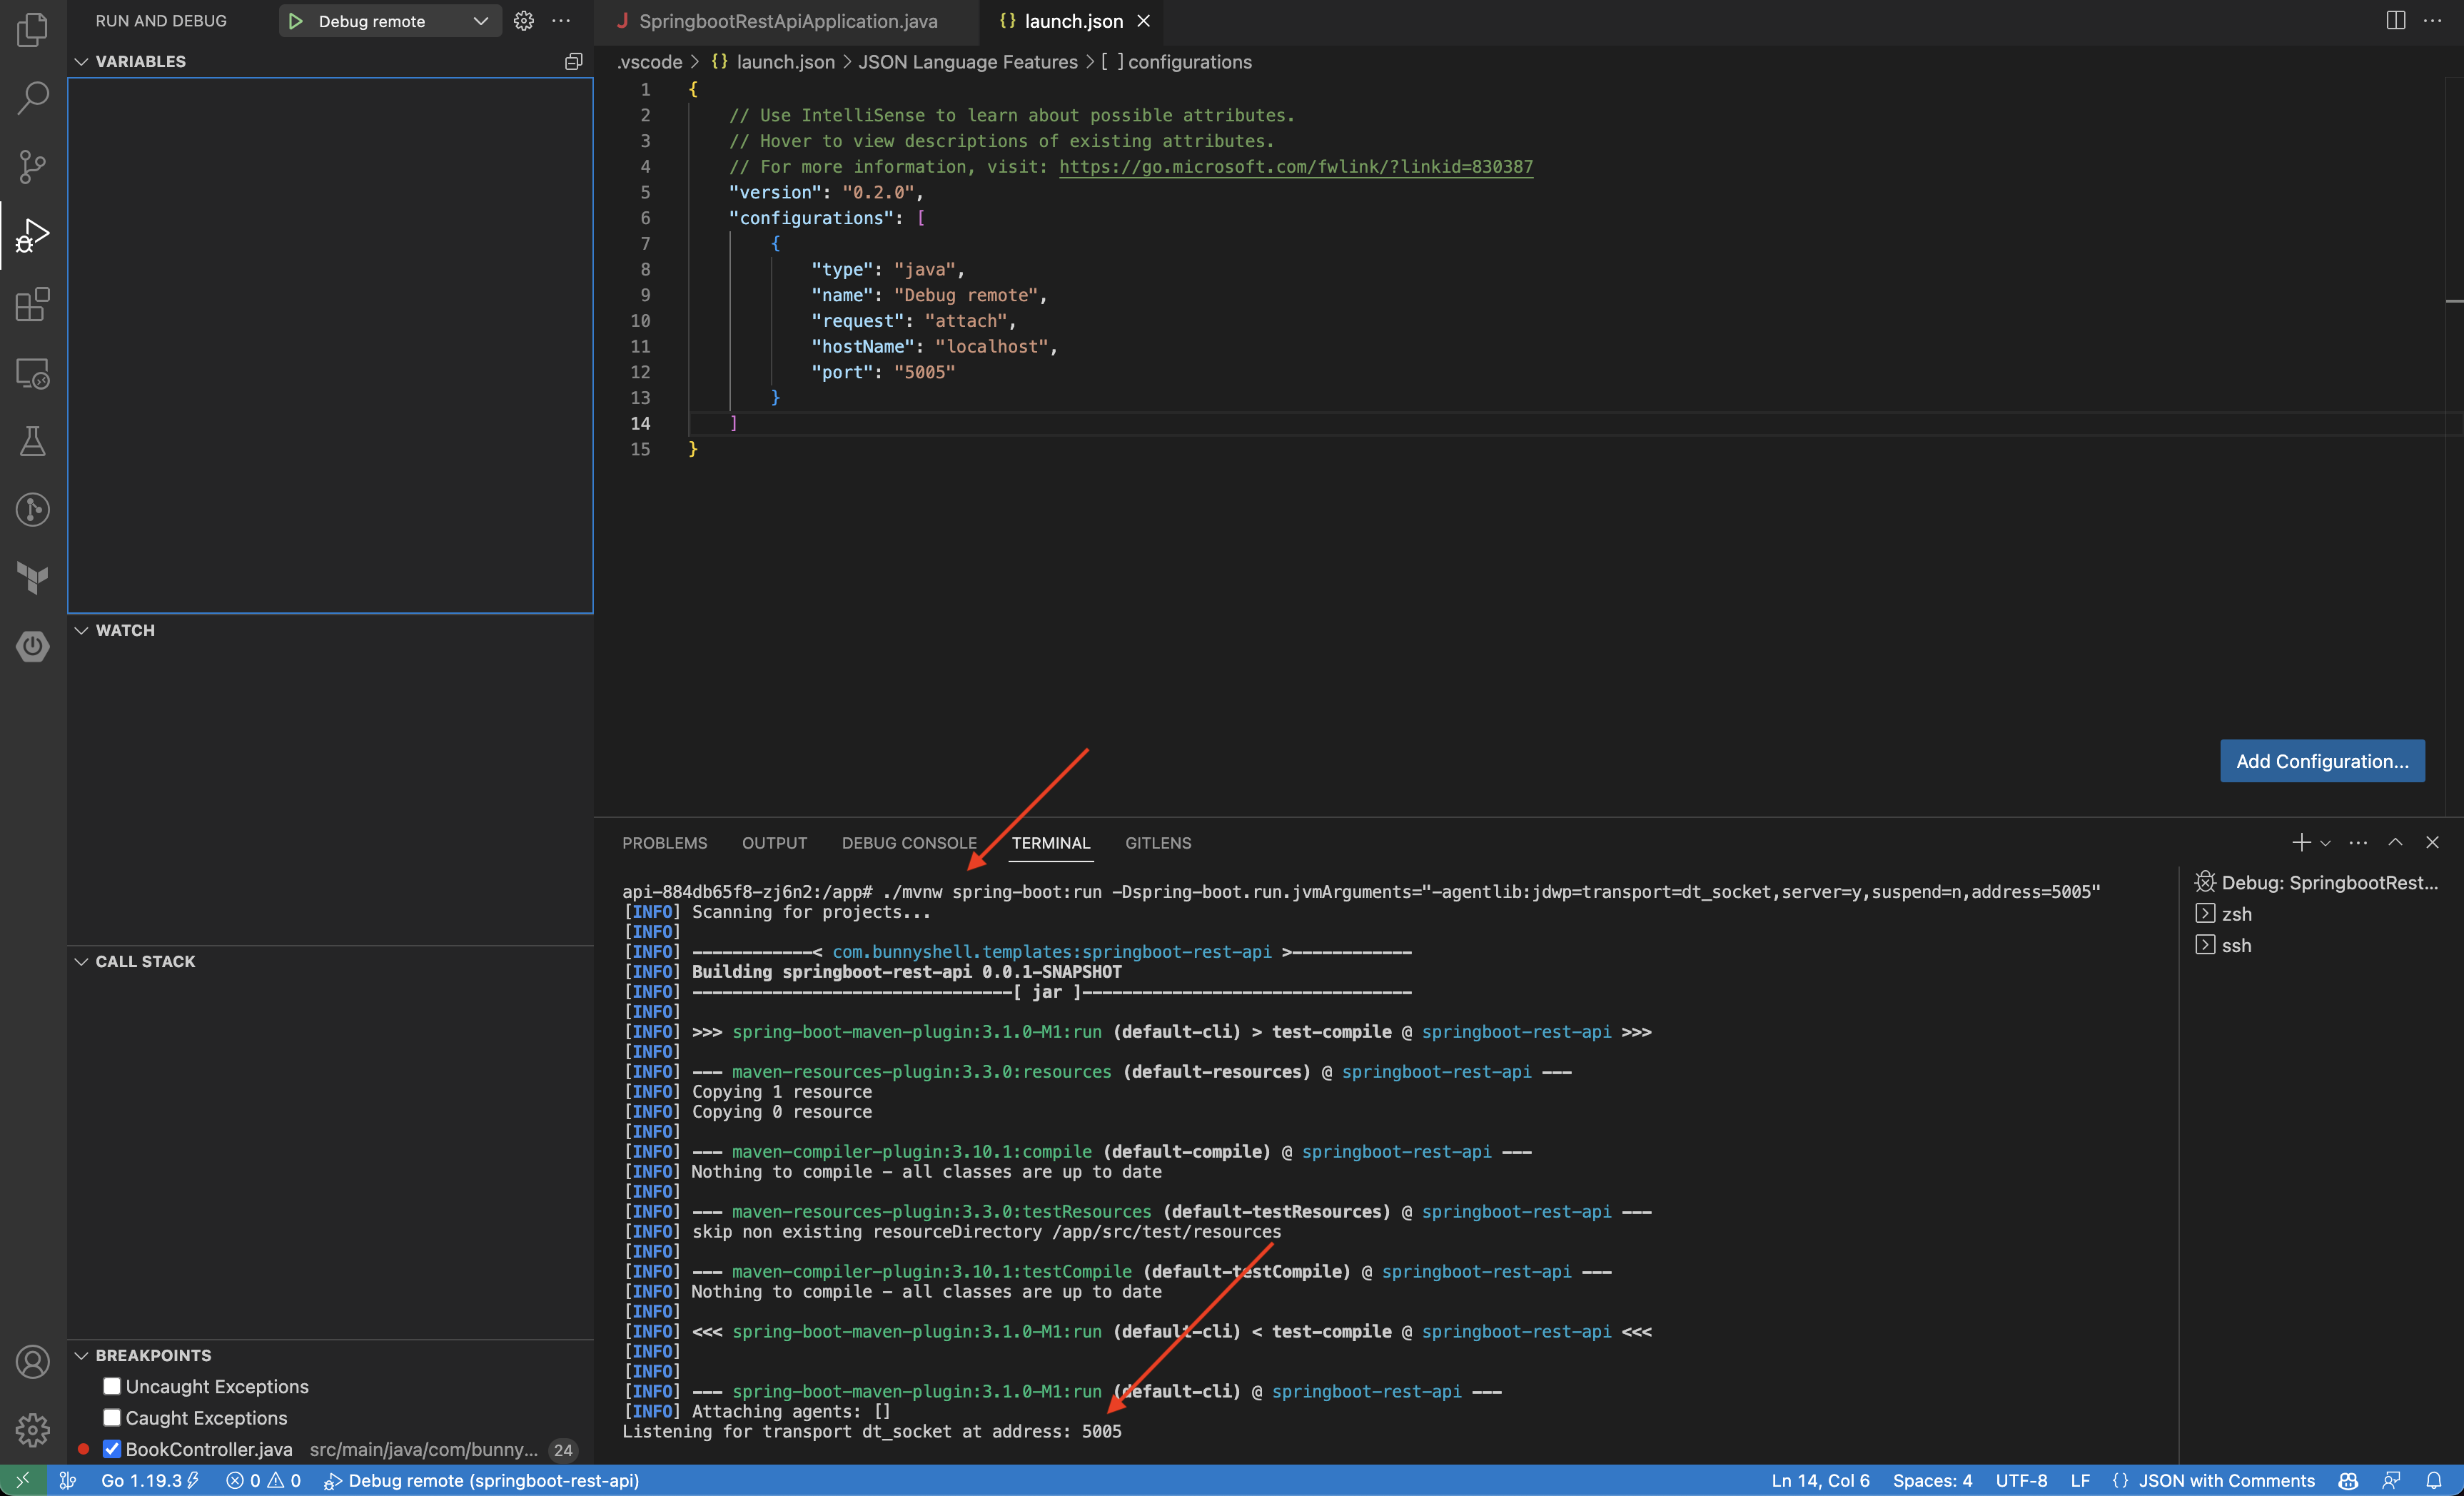
Before we can attach a debugger, we must first configure the JVM to allow debugging. We'll do this by setting a command line argument for the JVM:
-agentlib:jdwp=transport=dt_socket,server=y,suspend=n,address=5005Once the connection is established, we can proceed to setting up debugging.
Steps
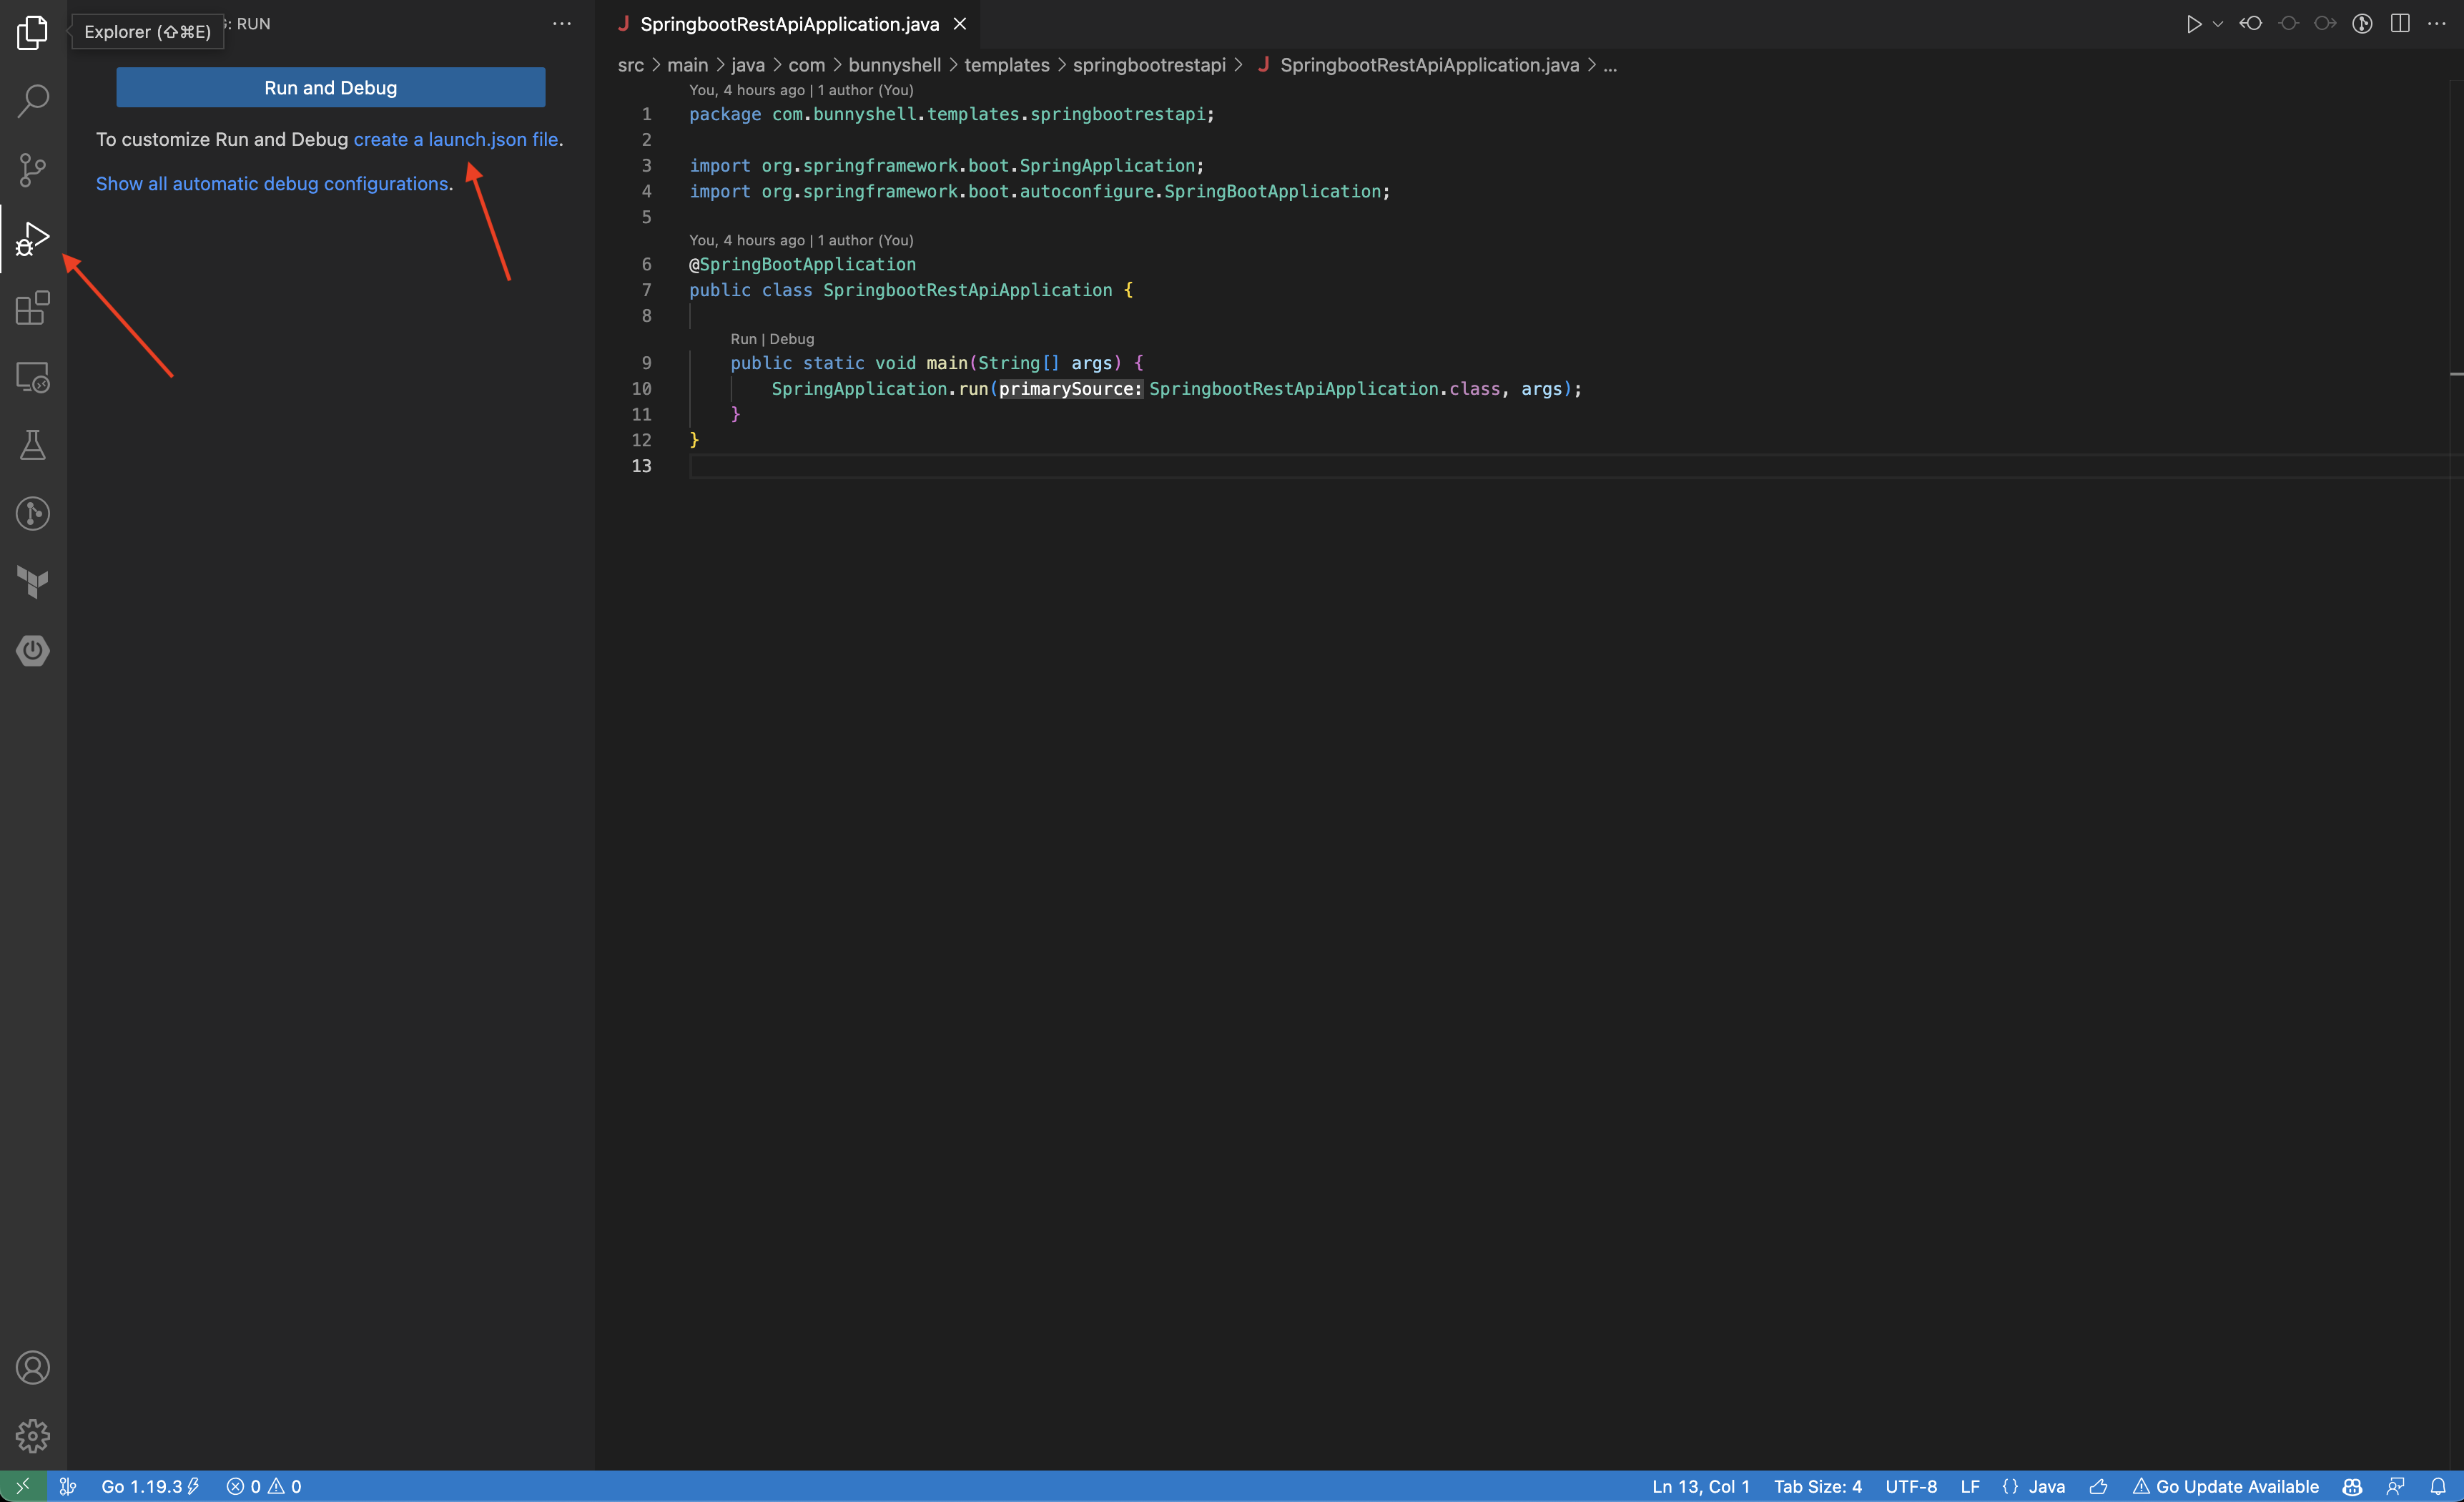
- Go to the Run and debug panel on the left navigation menu, then click create a launch.json file.
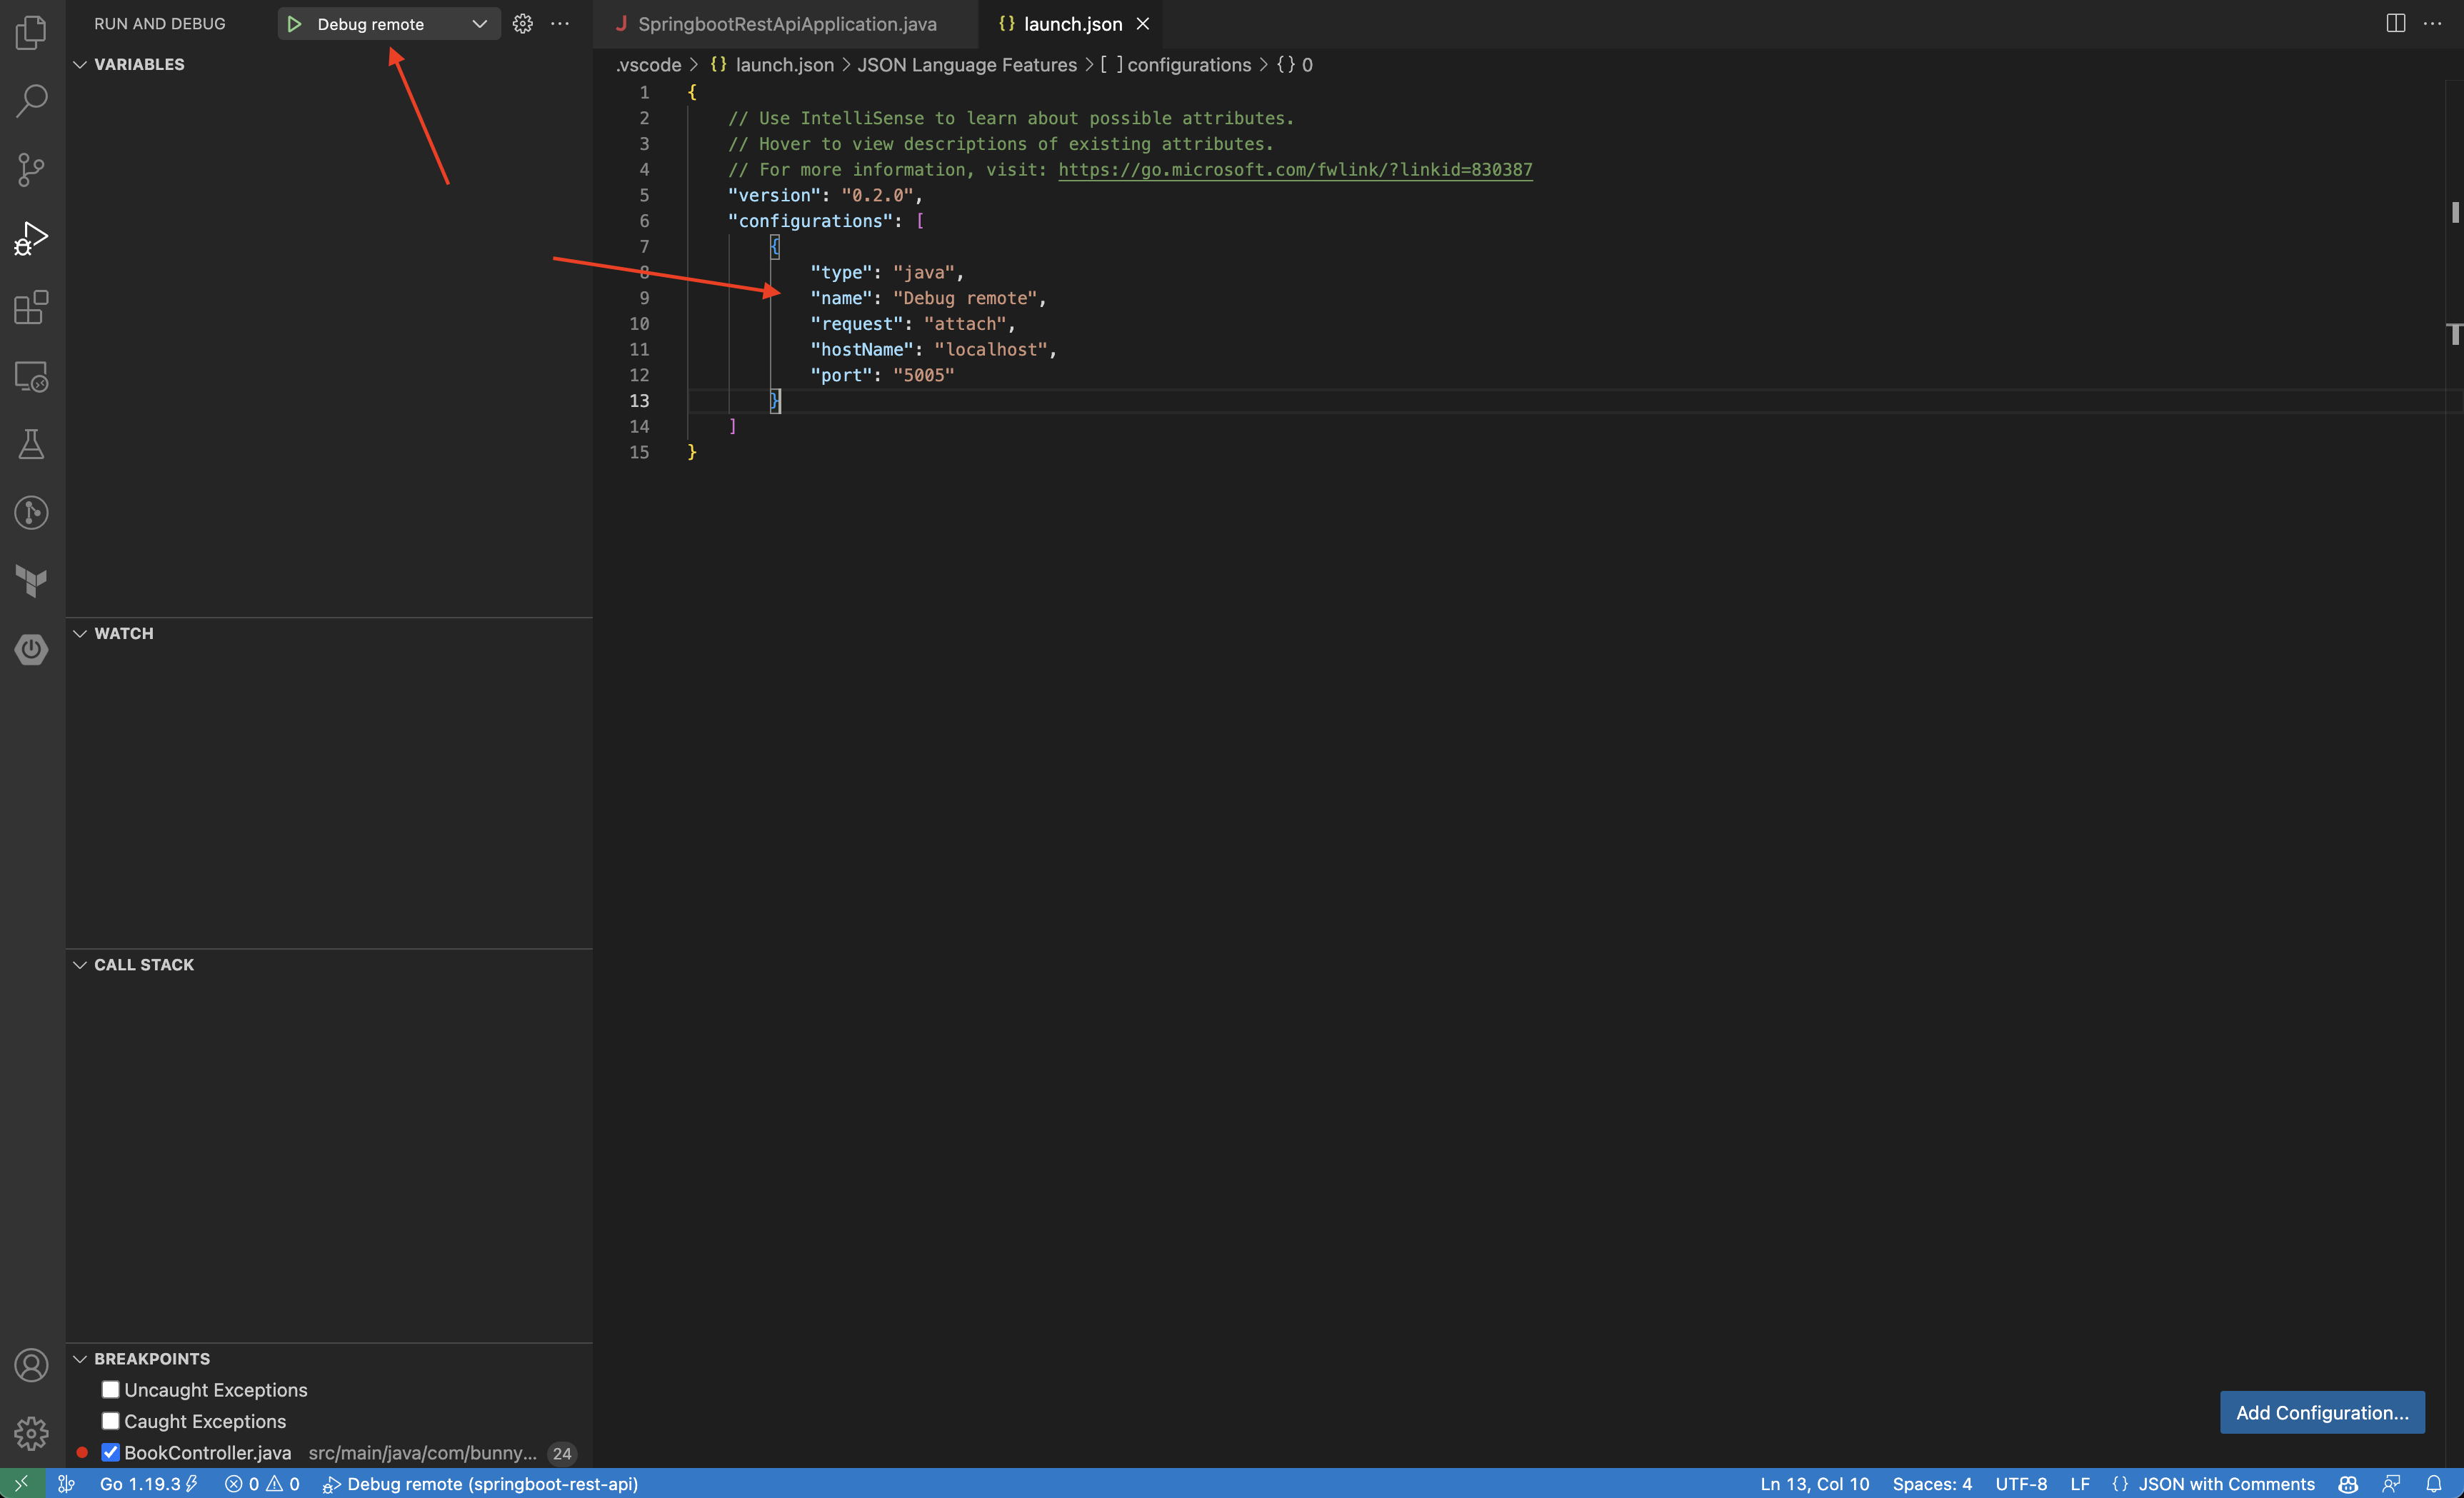
- Add a Attach: Java configuration (or ensure you already have it) under
configurations. Update the port if needed.
...
"configurations": [
  {
    "type": "java",
    "name": "Debug remote",
    "request": "attach",
    "hostName": "localhost",
    "port": "5005"
  }
]
...
You will be able to see the new configuration in the top of the screen.
- Open a terminal and start the JVM process with debugging enabled.
-
Click the green play button next to the configuration name. You will notice the layout of VS Code changing for debugging.
-
Add a breakpoint.
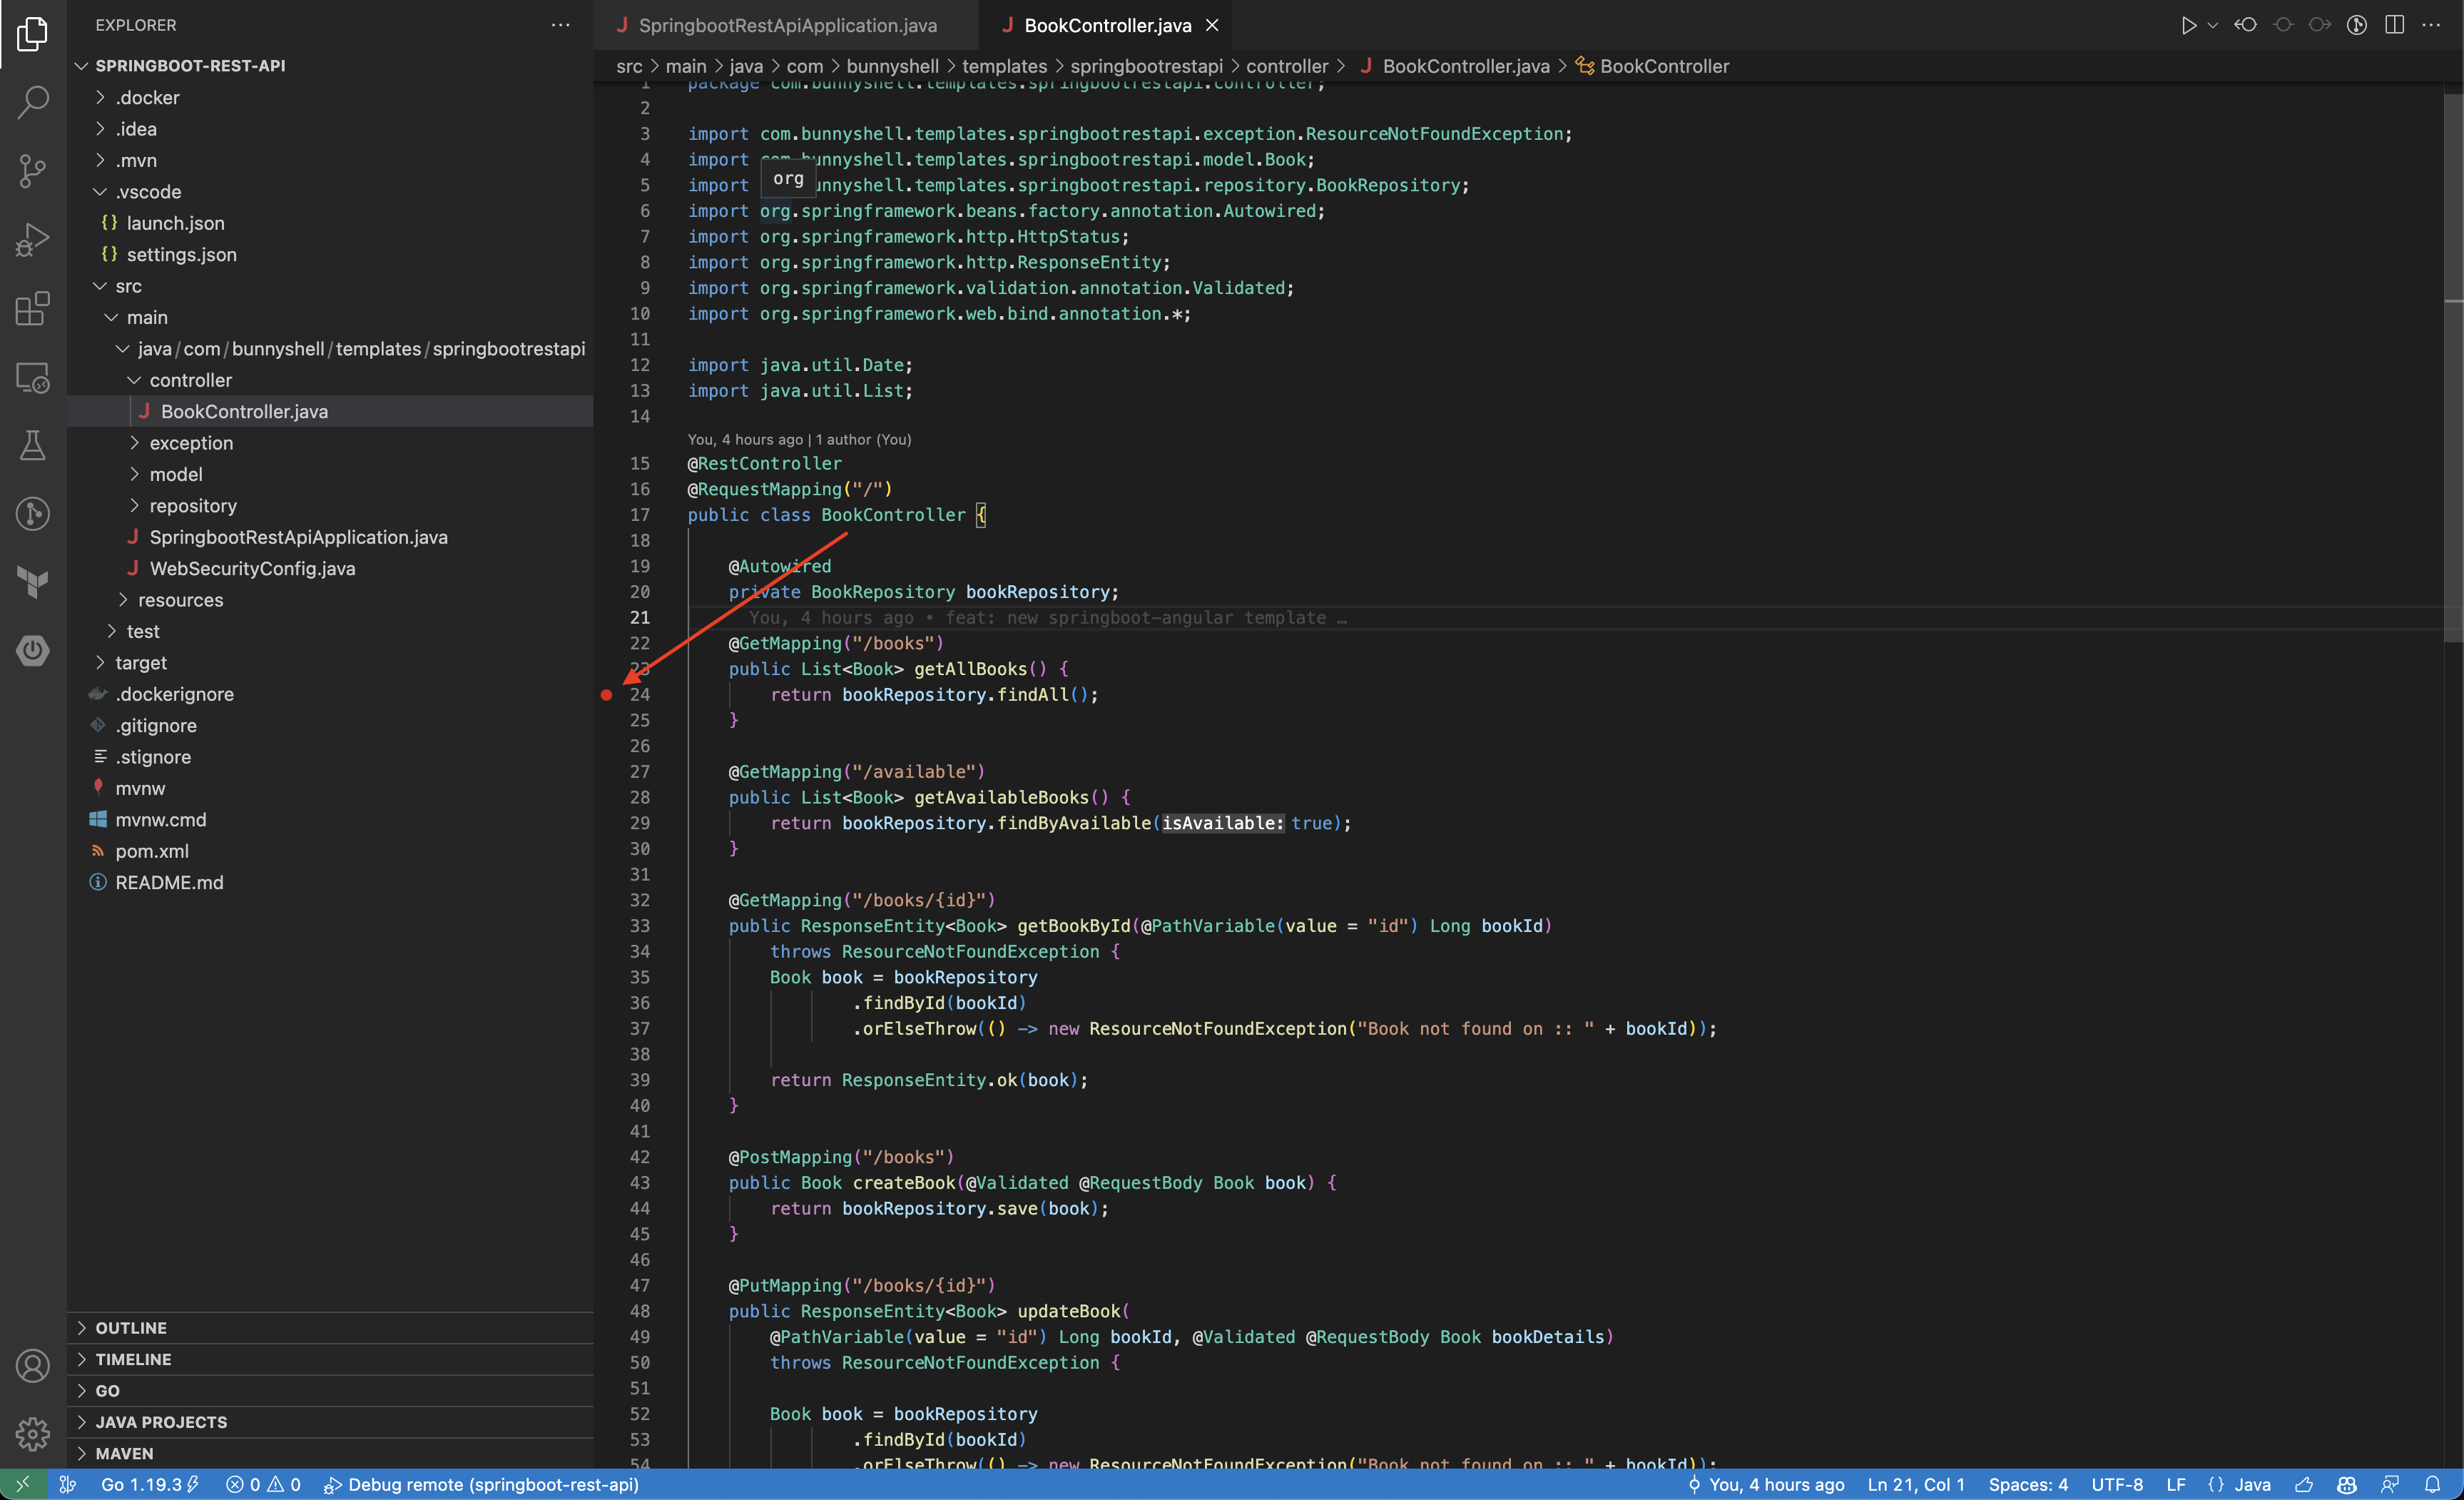
- Access the endpoint of the application to generate a request, and you will notice the breakpoint being hit.
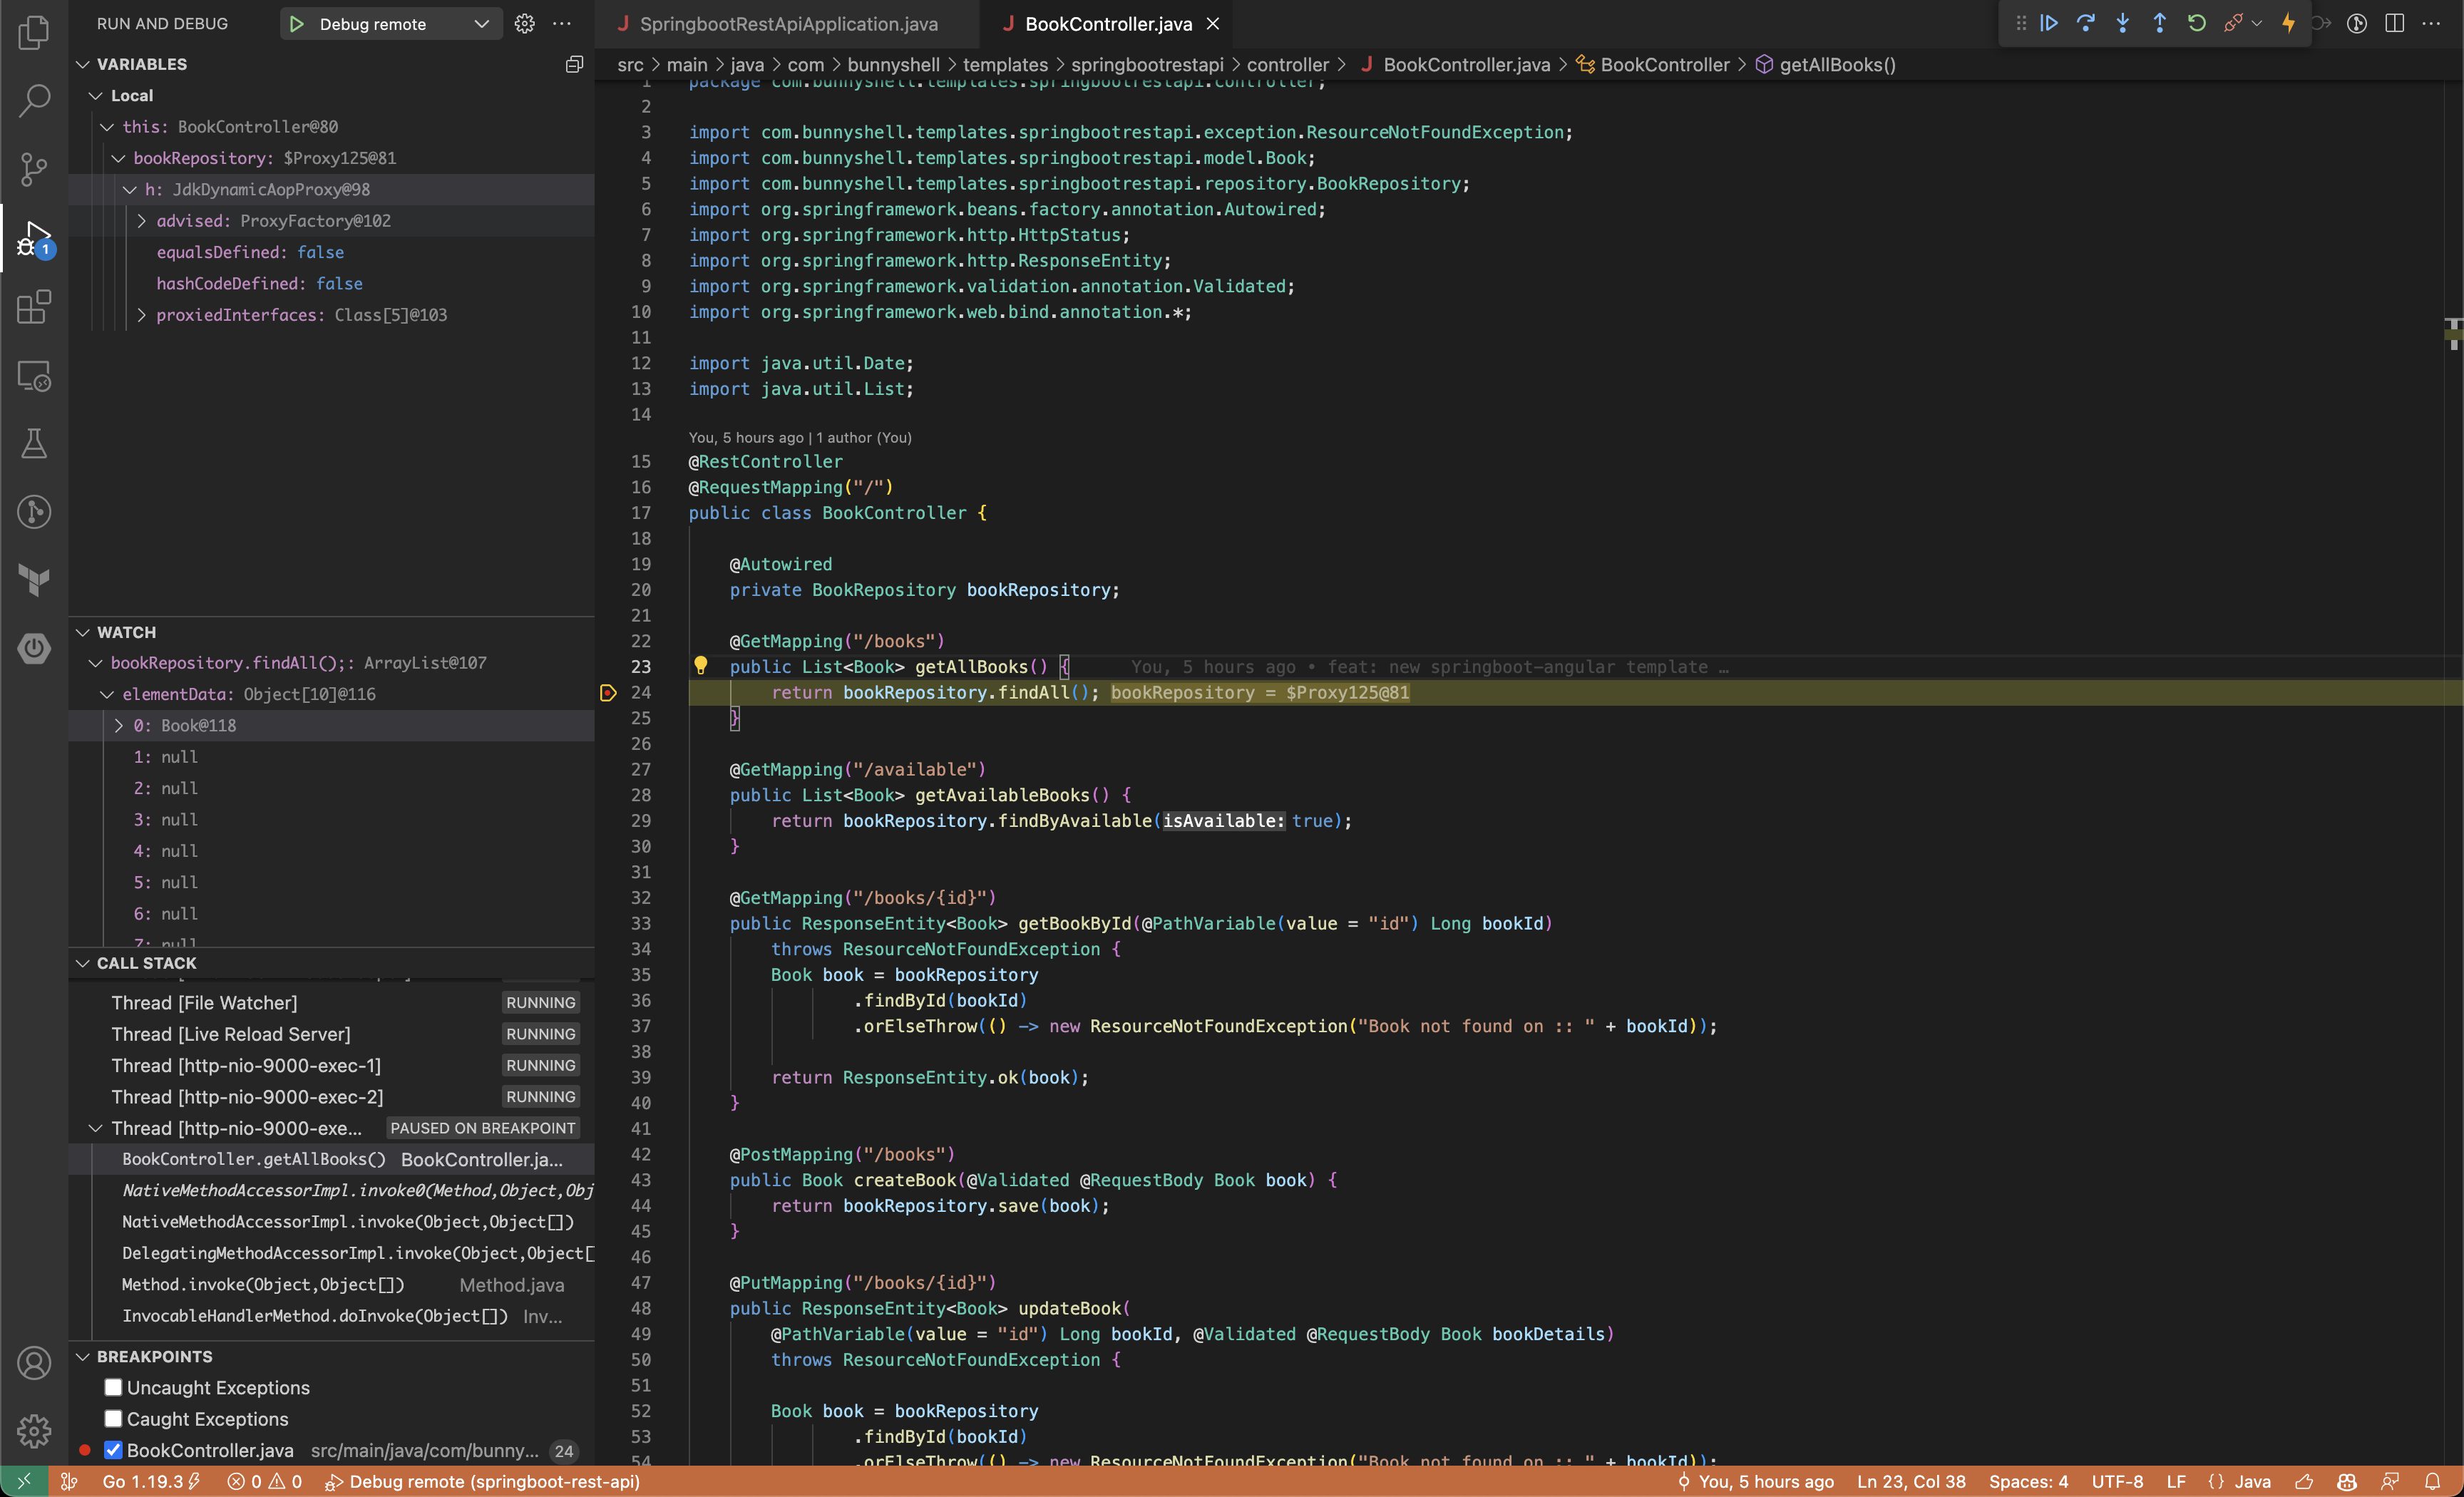
Congratulations! You have now got a completely working environment for Remote Development in the cloud.
Updated 8 months ago
