Troubleshooting workflows
Debugging deploy / destroy / start / stop
With troubleshooting, being practical is best. So, let' take a concrete example to analyze the features based on.
Environment Details
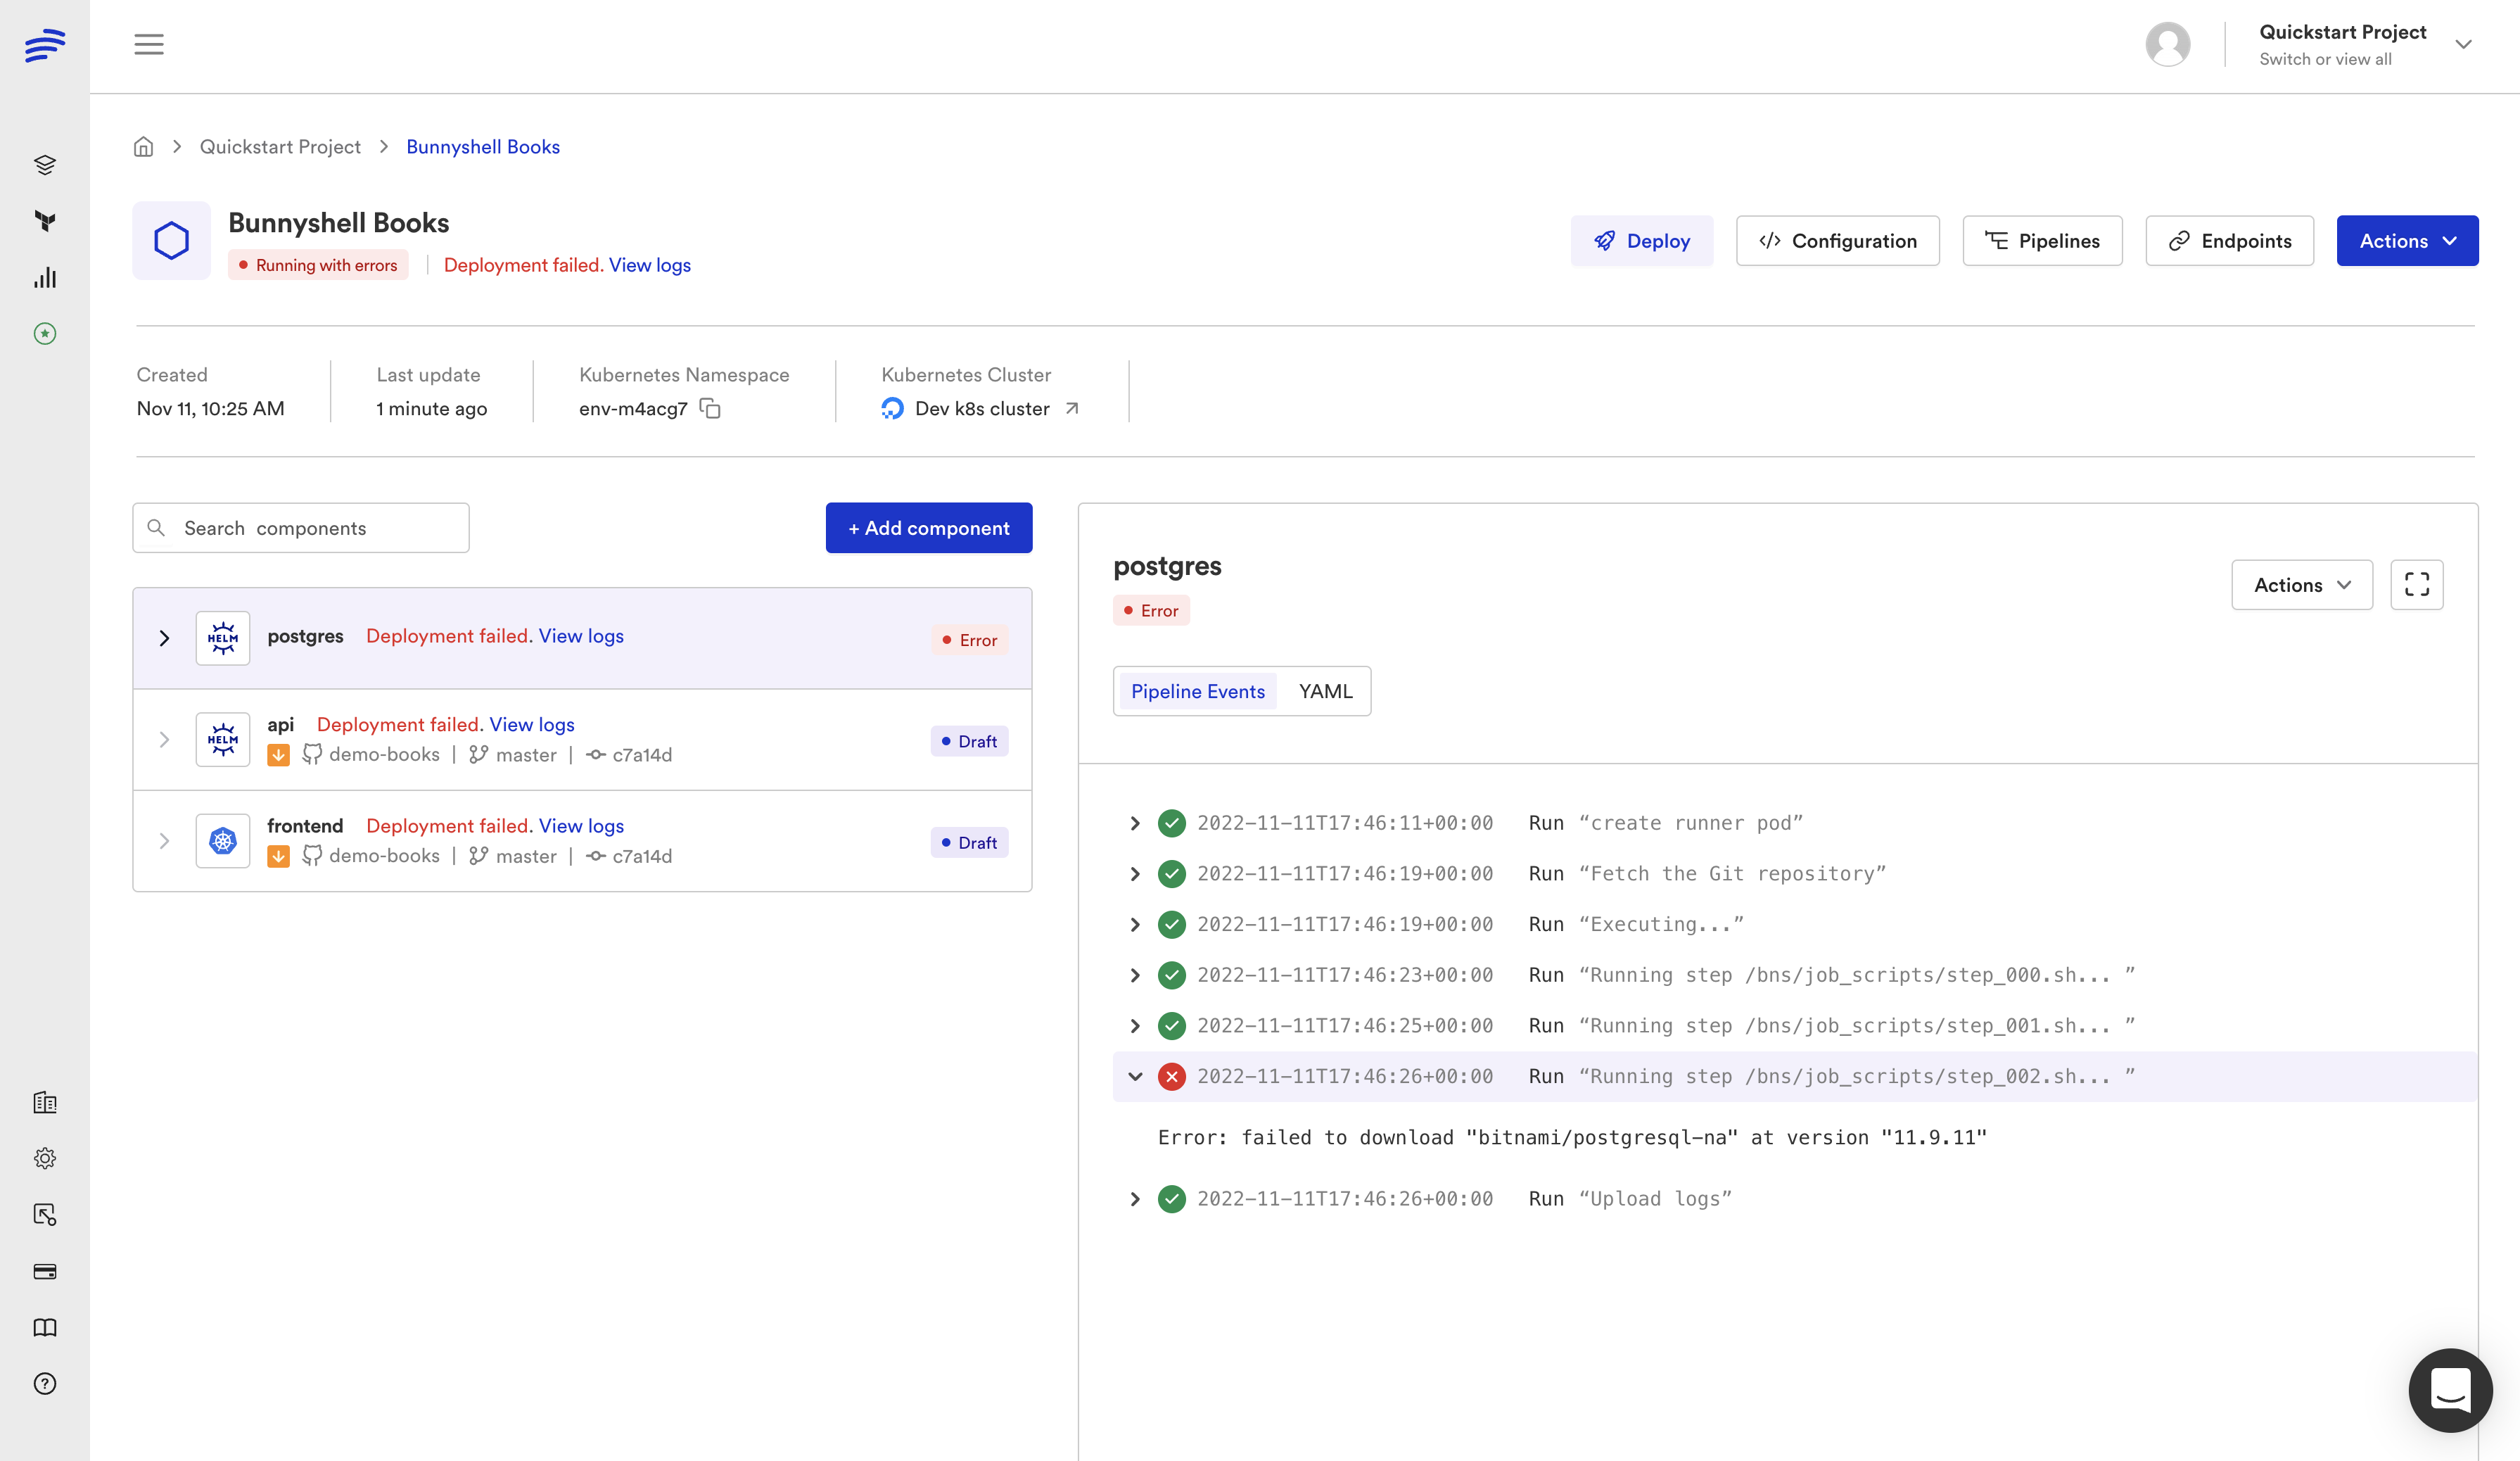
If a deployment (or any other workflow) fails, you will be able to see from the Environment Details that the latest pipeline failed. You will also see the culprit Component, the one with the Error status. In this case, it's postgres.
On the right side, you will see the pipeline logs, and the step containing the error is automatically opened, so you see the issue at a glance.
In this case, it's crystal clear. There's a mistake in the image for the the Helm install of the Postgres database. The image is bitnami/postgresql-na instead of bitnami/postgresql.

Pipeline view
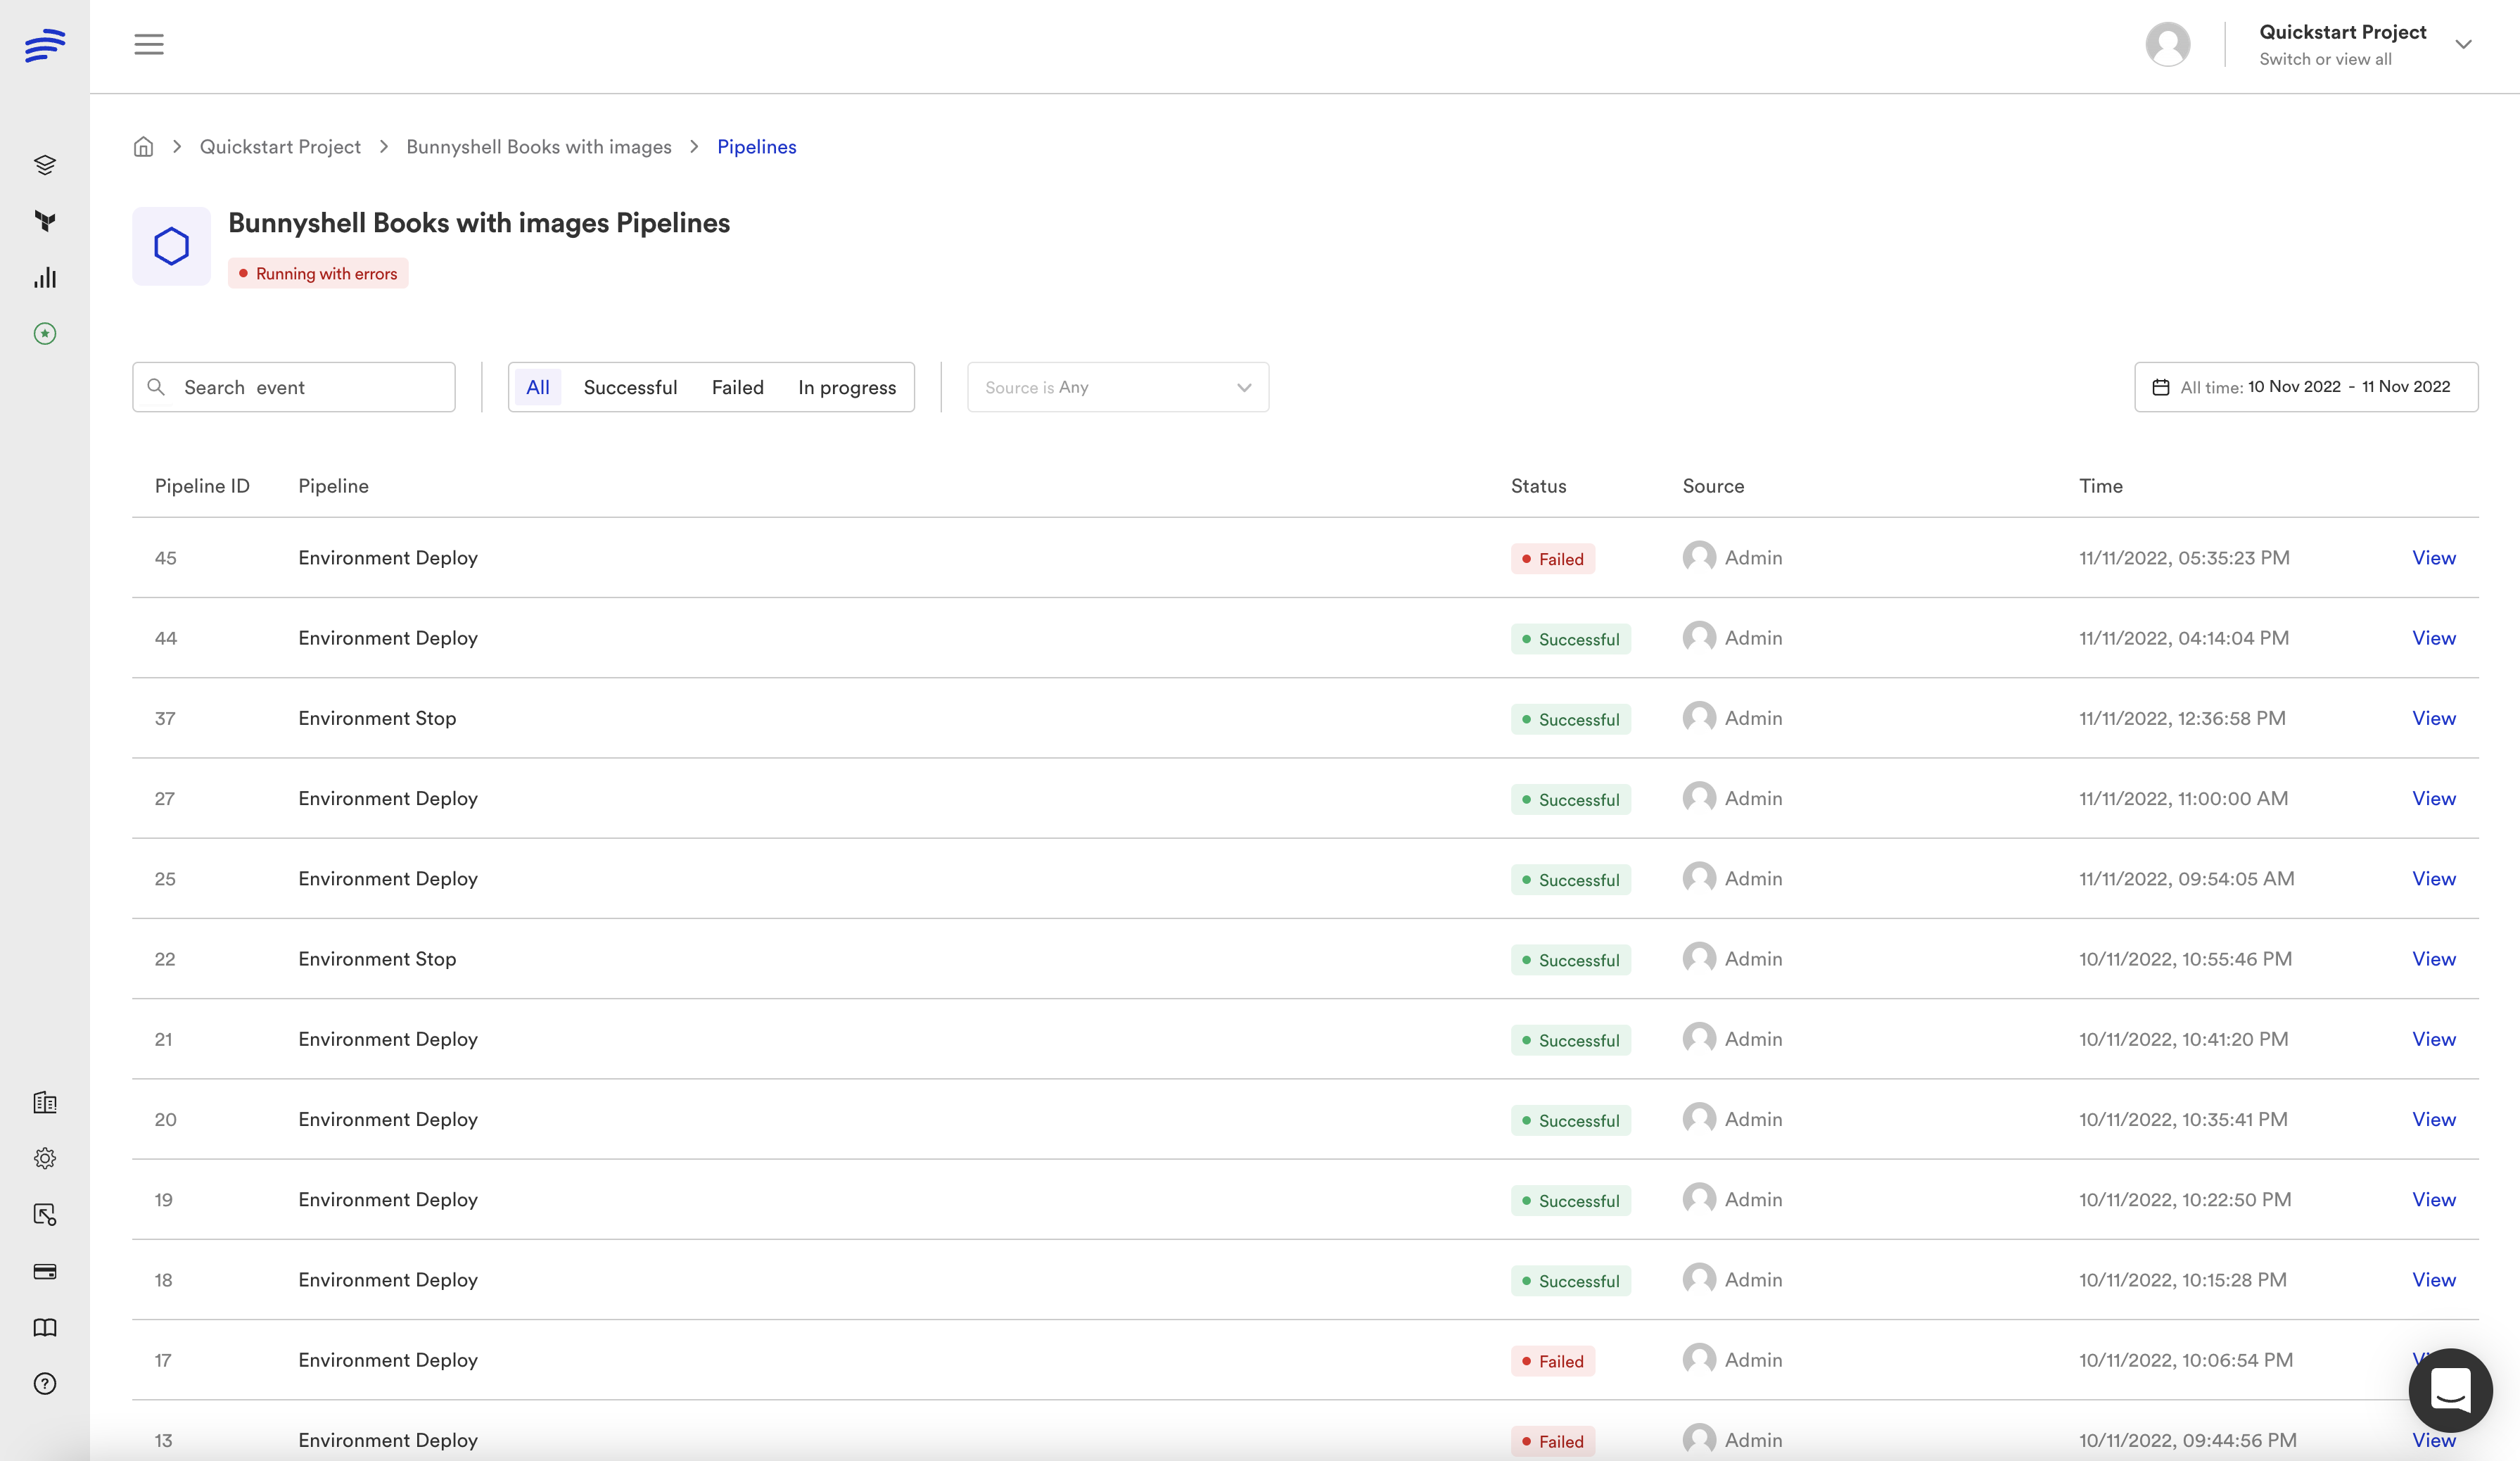
Clicking on the Pipelines button in the top right of the Environment Details screen, you will reach the Pipeline Listing.

You will reach the Pipeline Details screen by either:
- selecting the most recent pipeline from the pipeline list
OR - by clicking View logs from the error message displayed in the Environment Details or Environment Listing screens

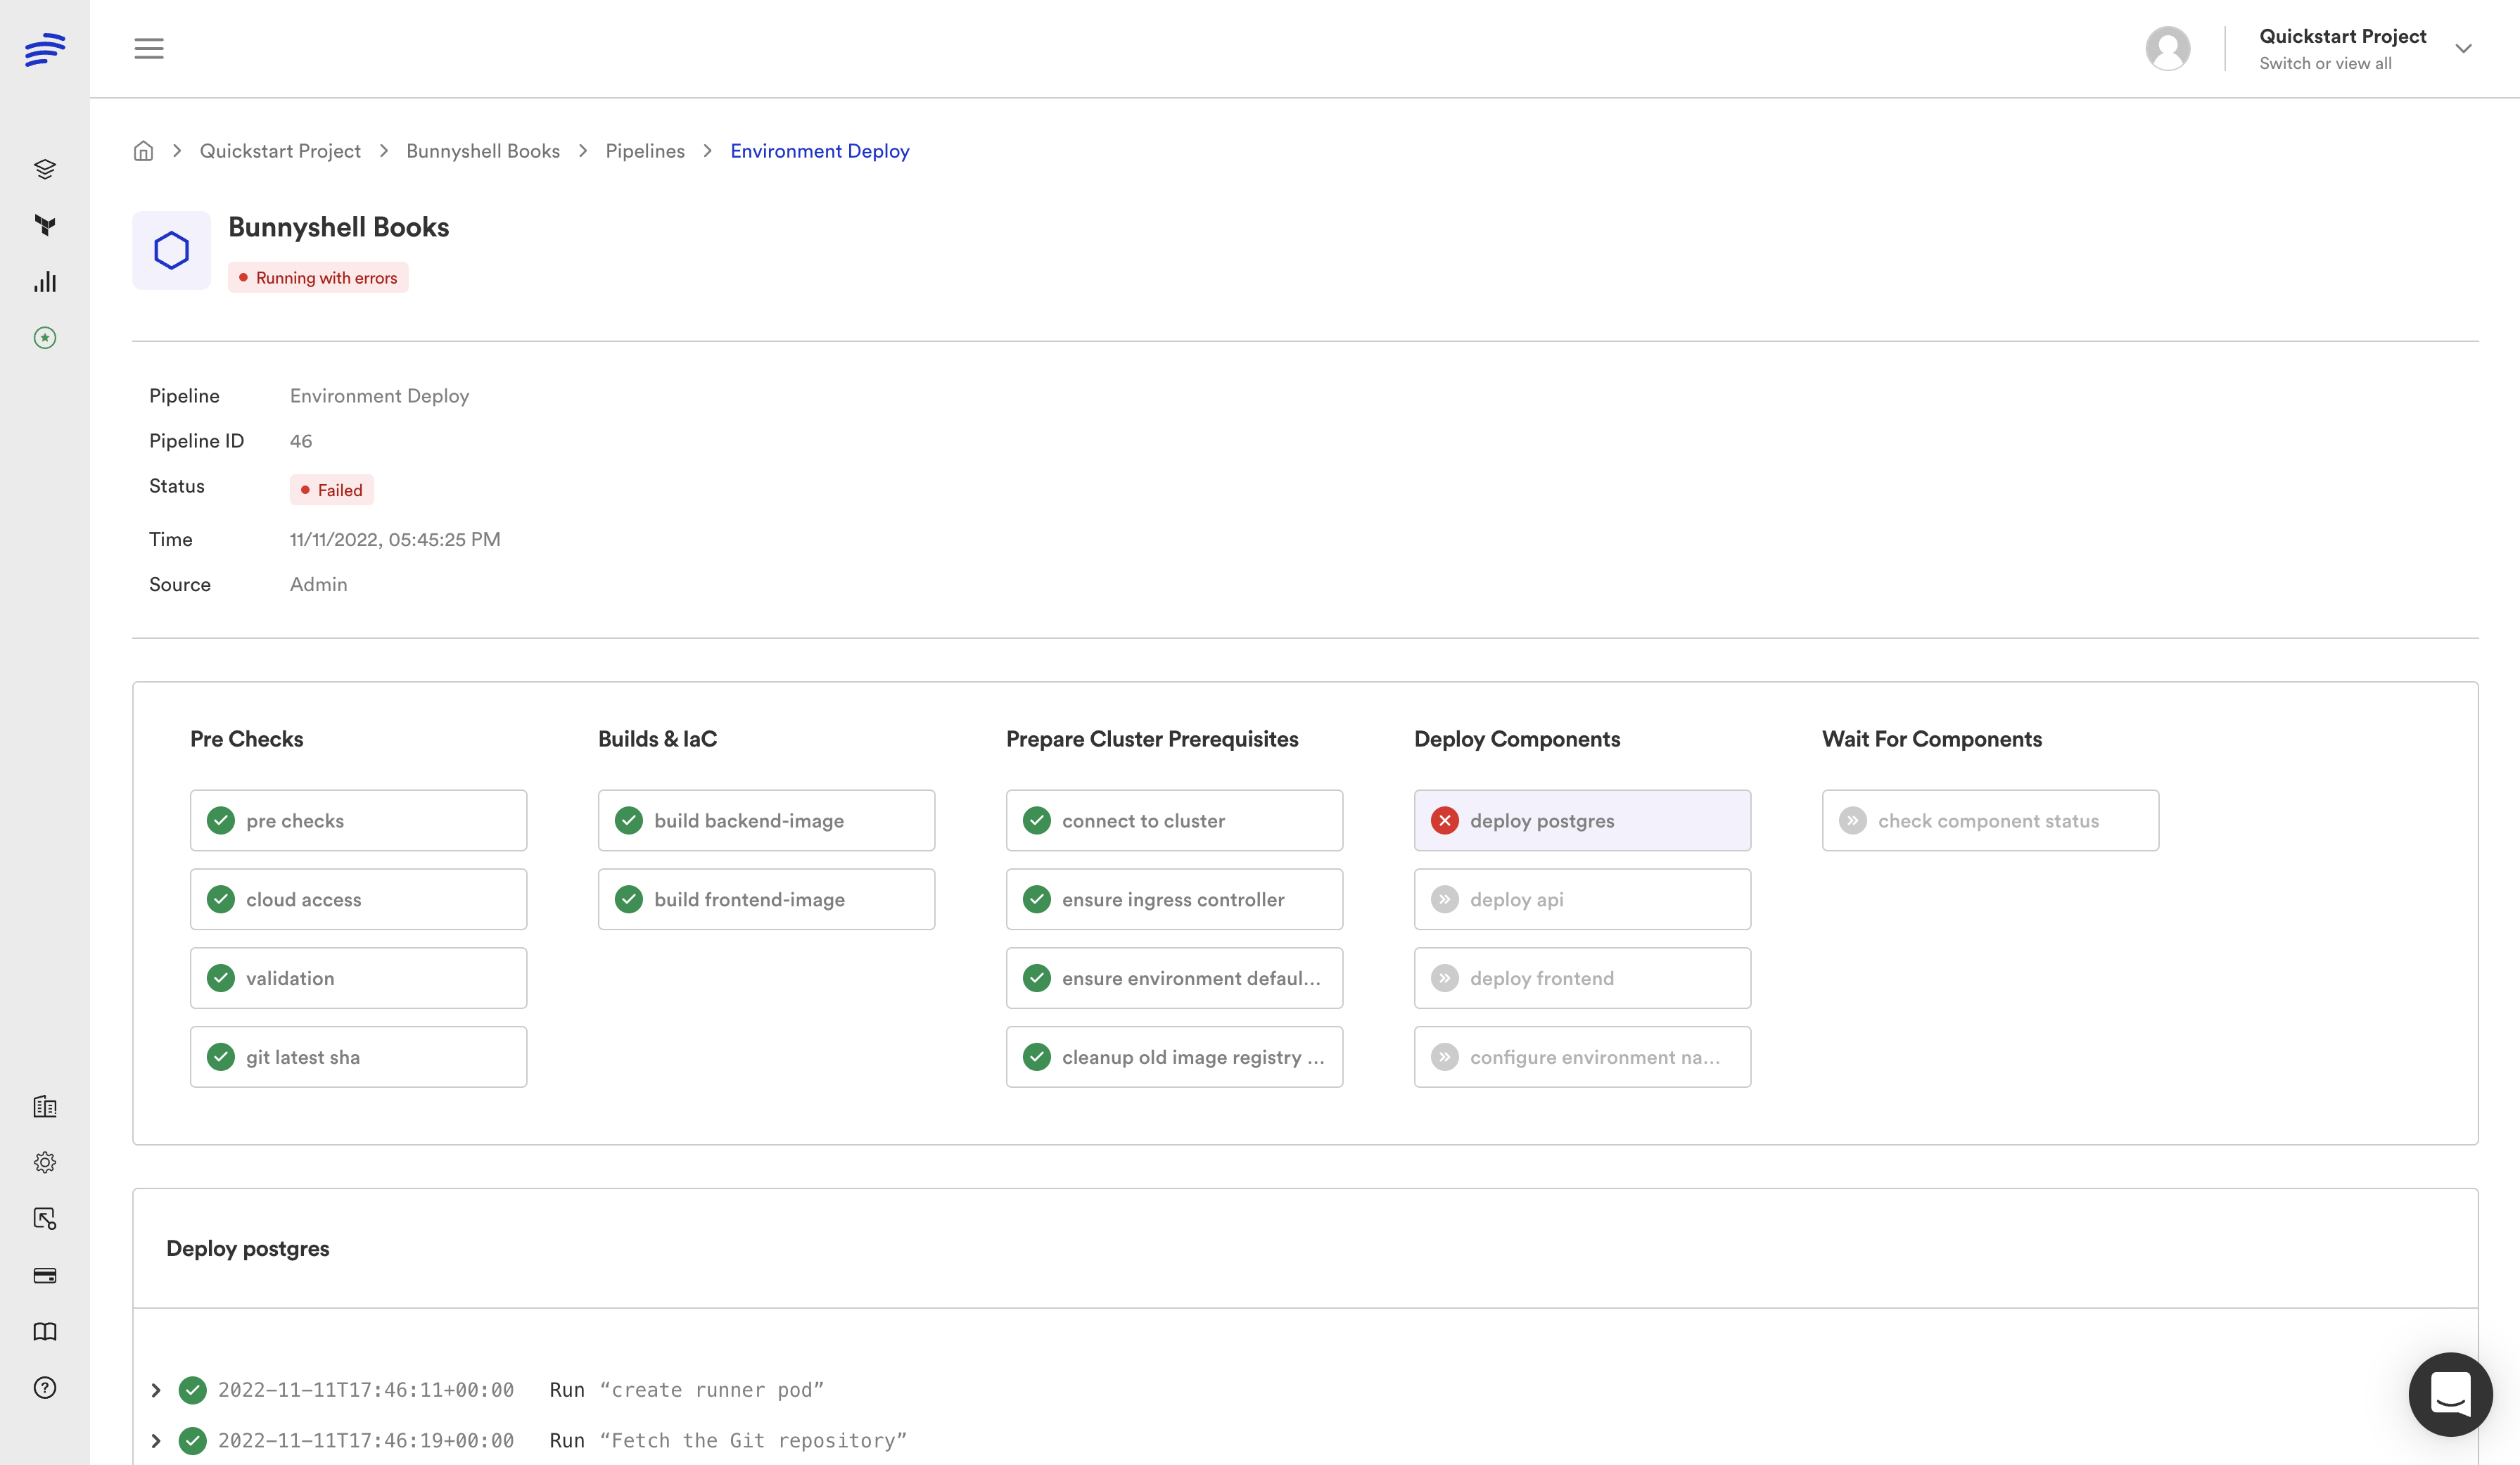
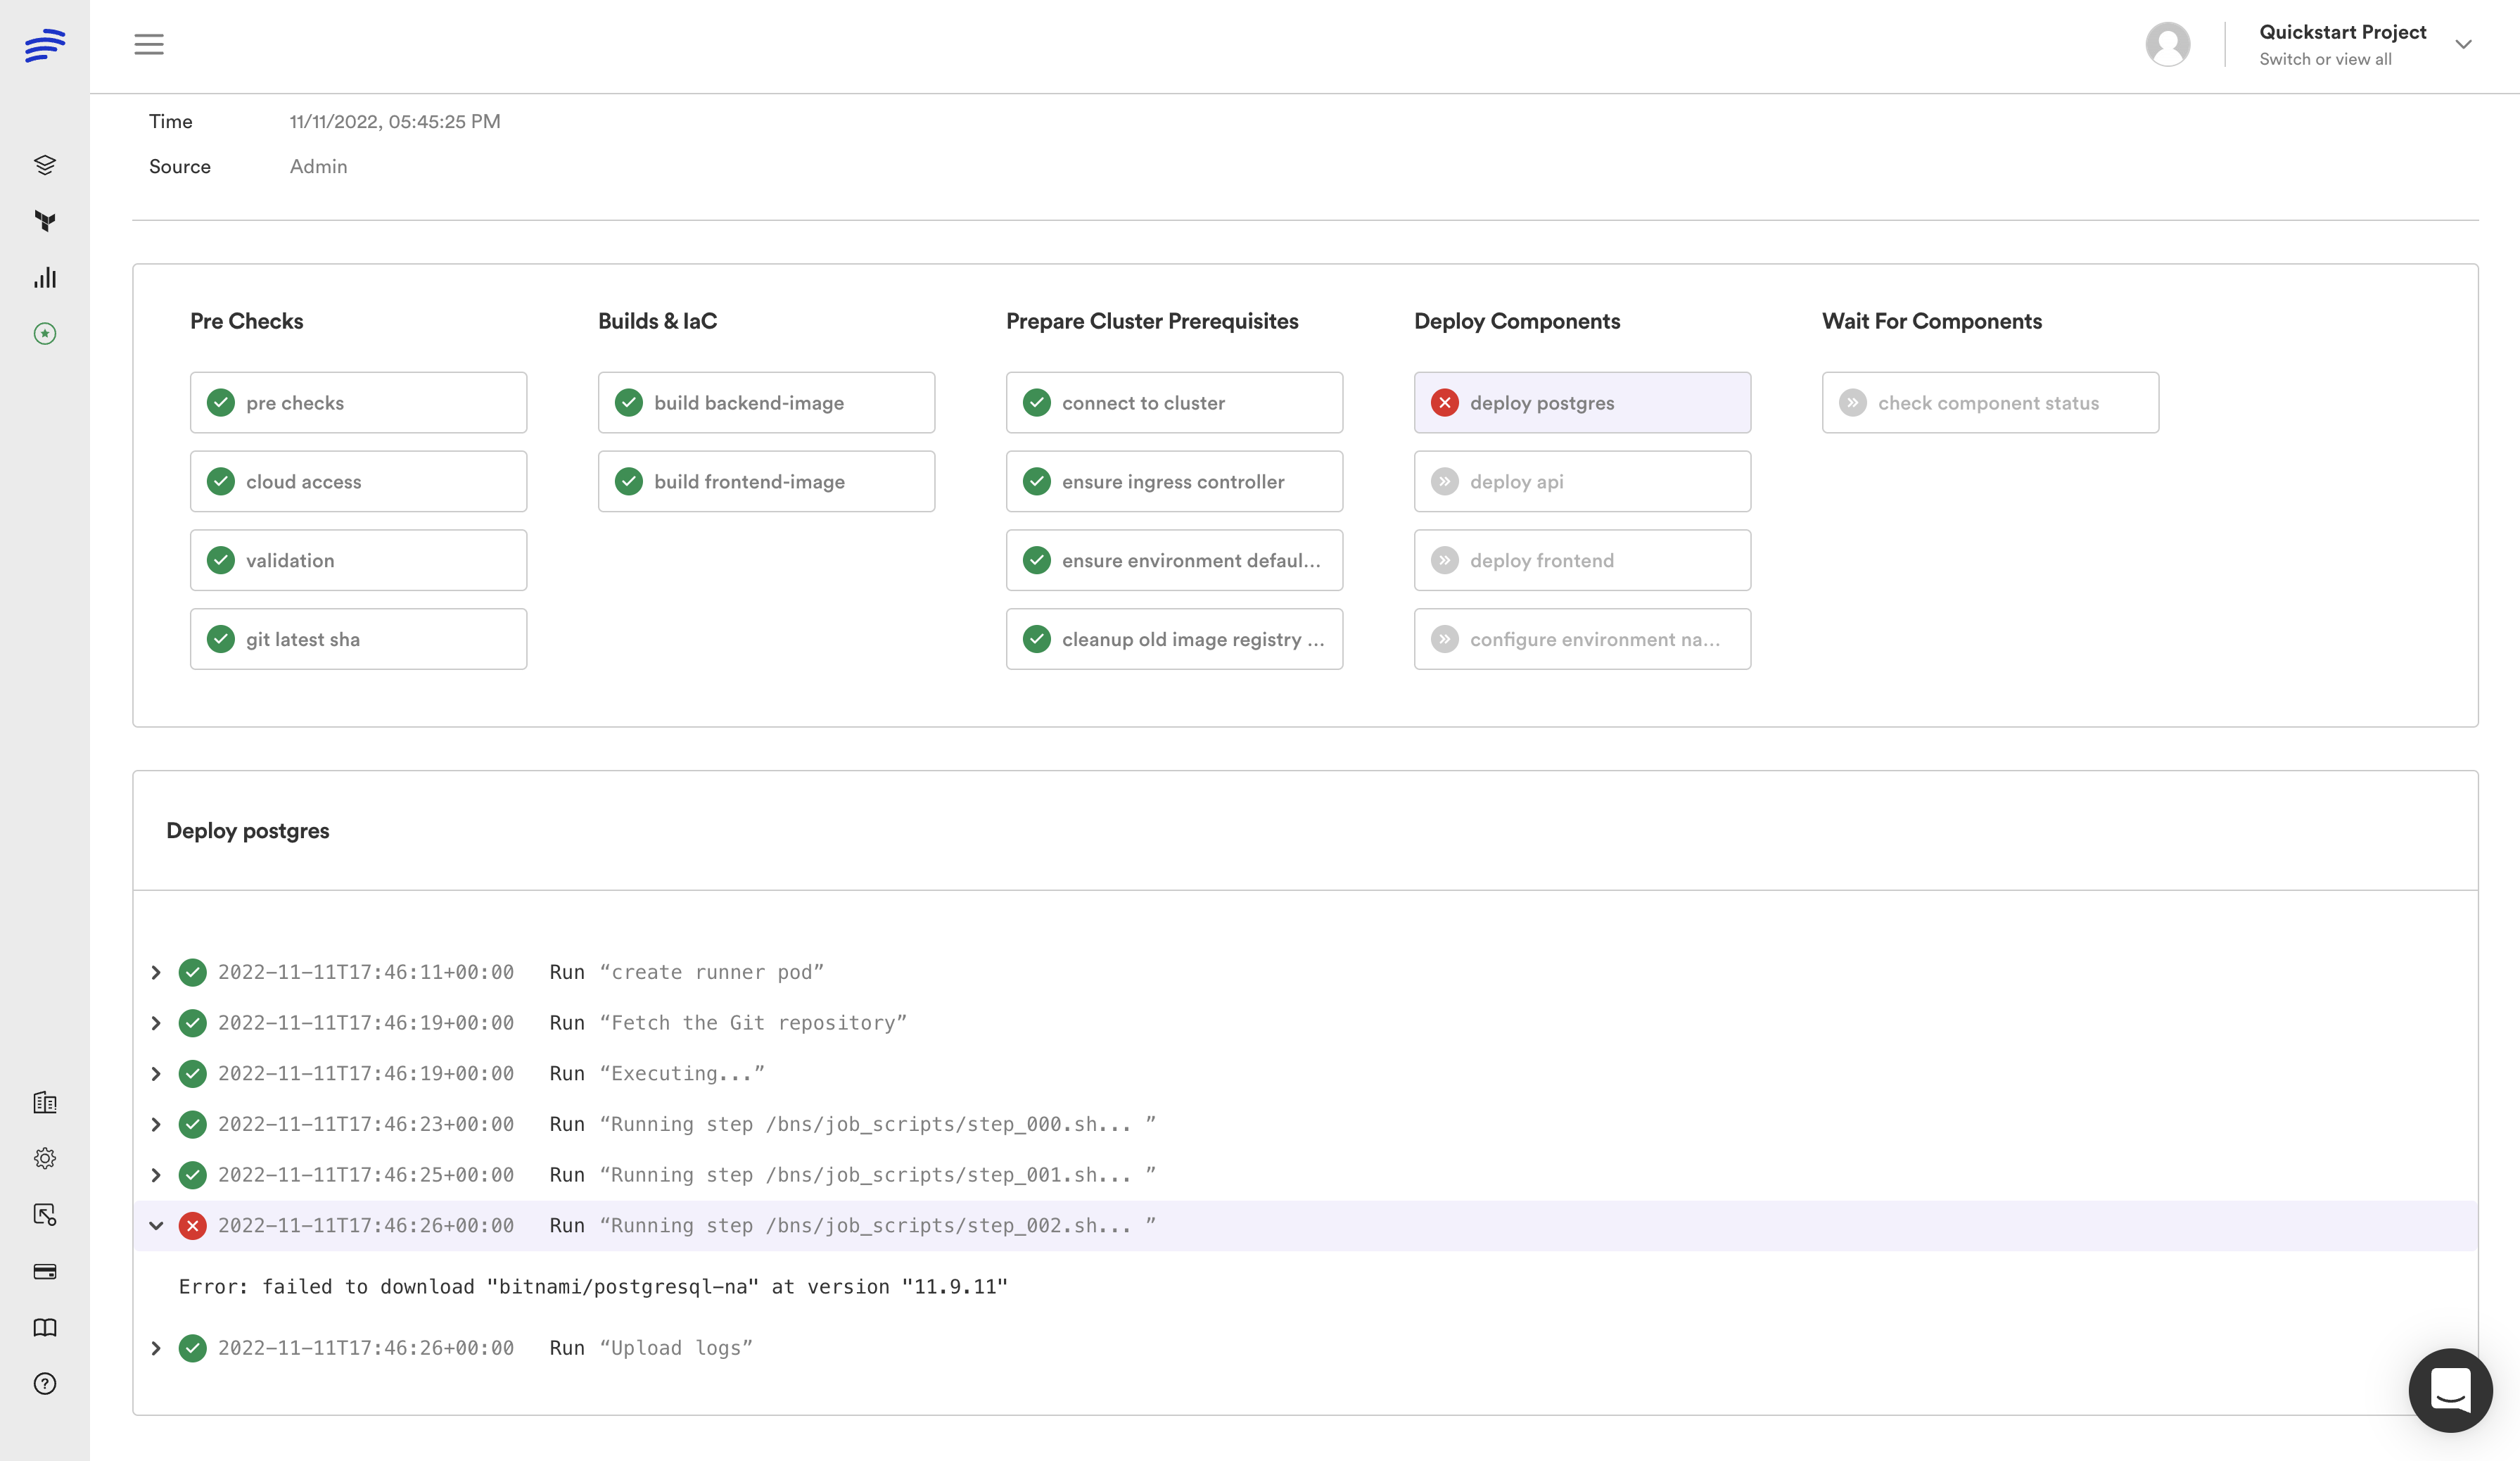
You will easily spot the failed Job, as it's marked in red and automatically open. If you scroll down a bit, you will see all the Steps ran in the Job and you will also be able to easily identify the failed one, as, it's again marked in red and automatically expanded.
In our case (the same one as above) the image name is not correct.

Updated 8 months ago
