Debugging frontend in Jetbrains
Let's take an example, based on our Demo Books application.
Context
Assuming we have a development Environment based on Demo Books, with a React frontend Component.
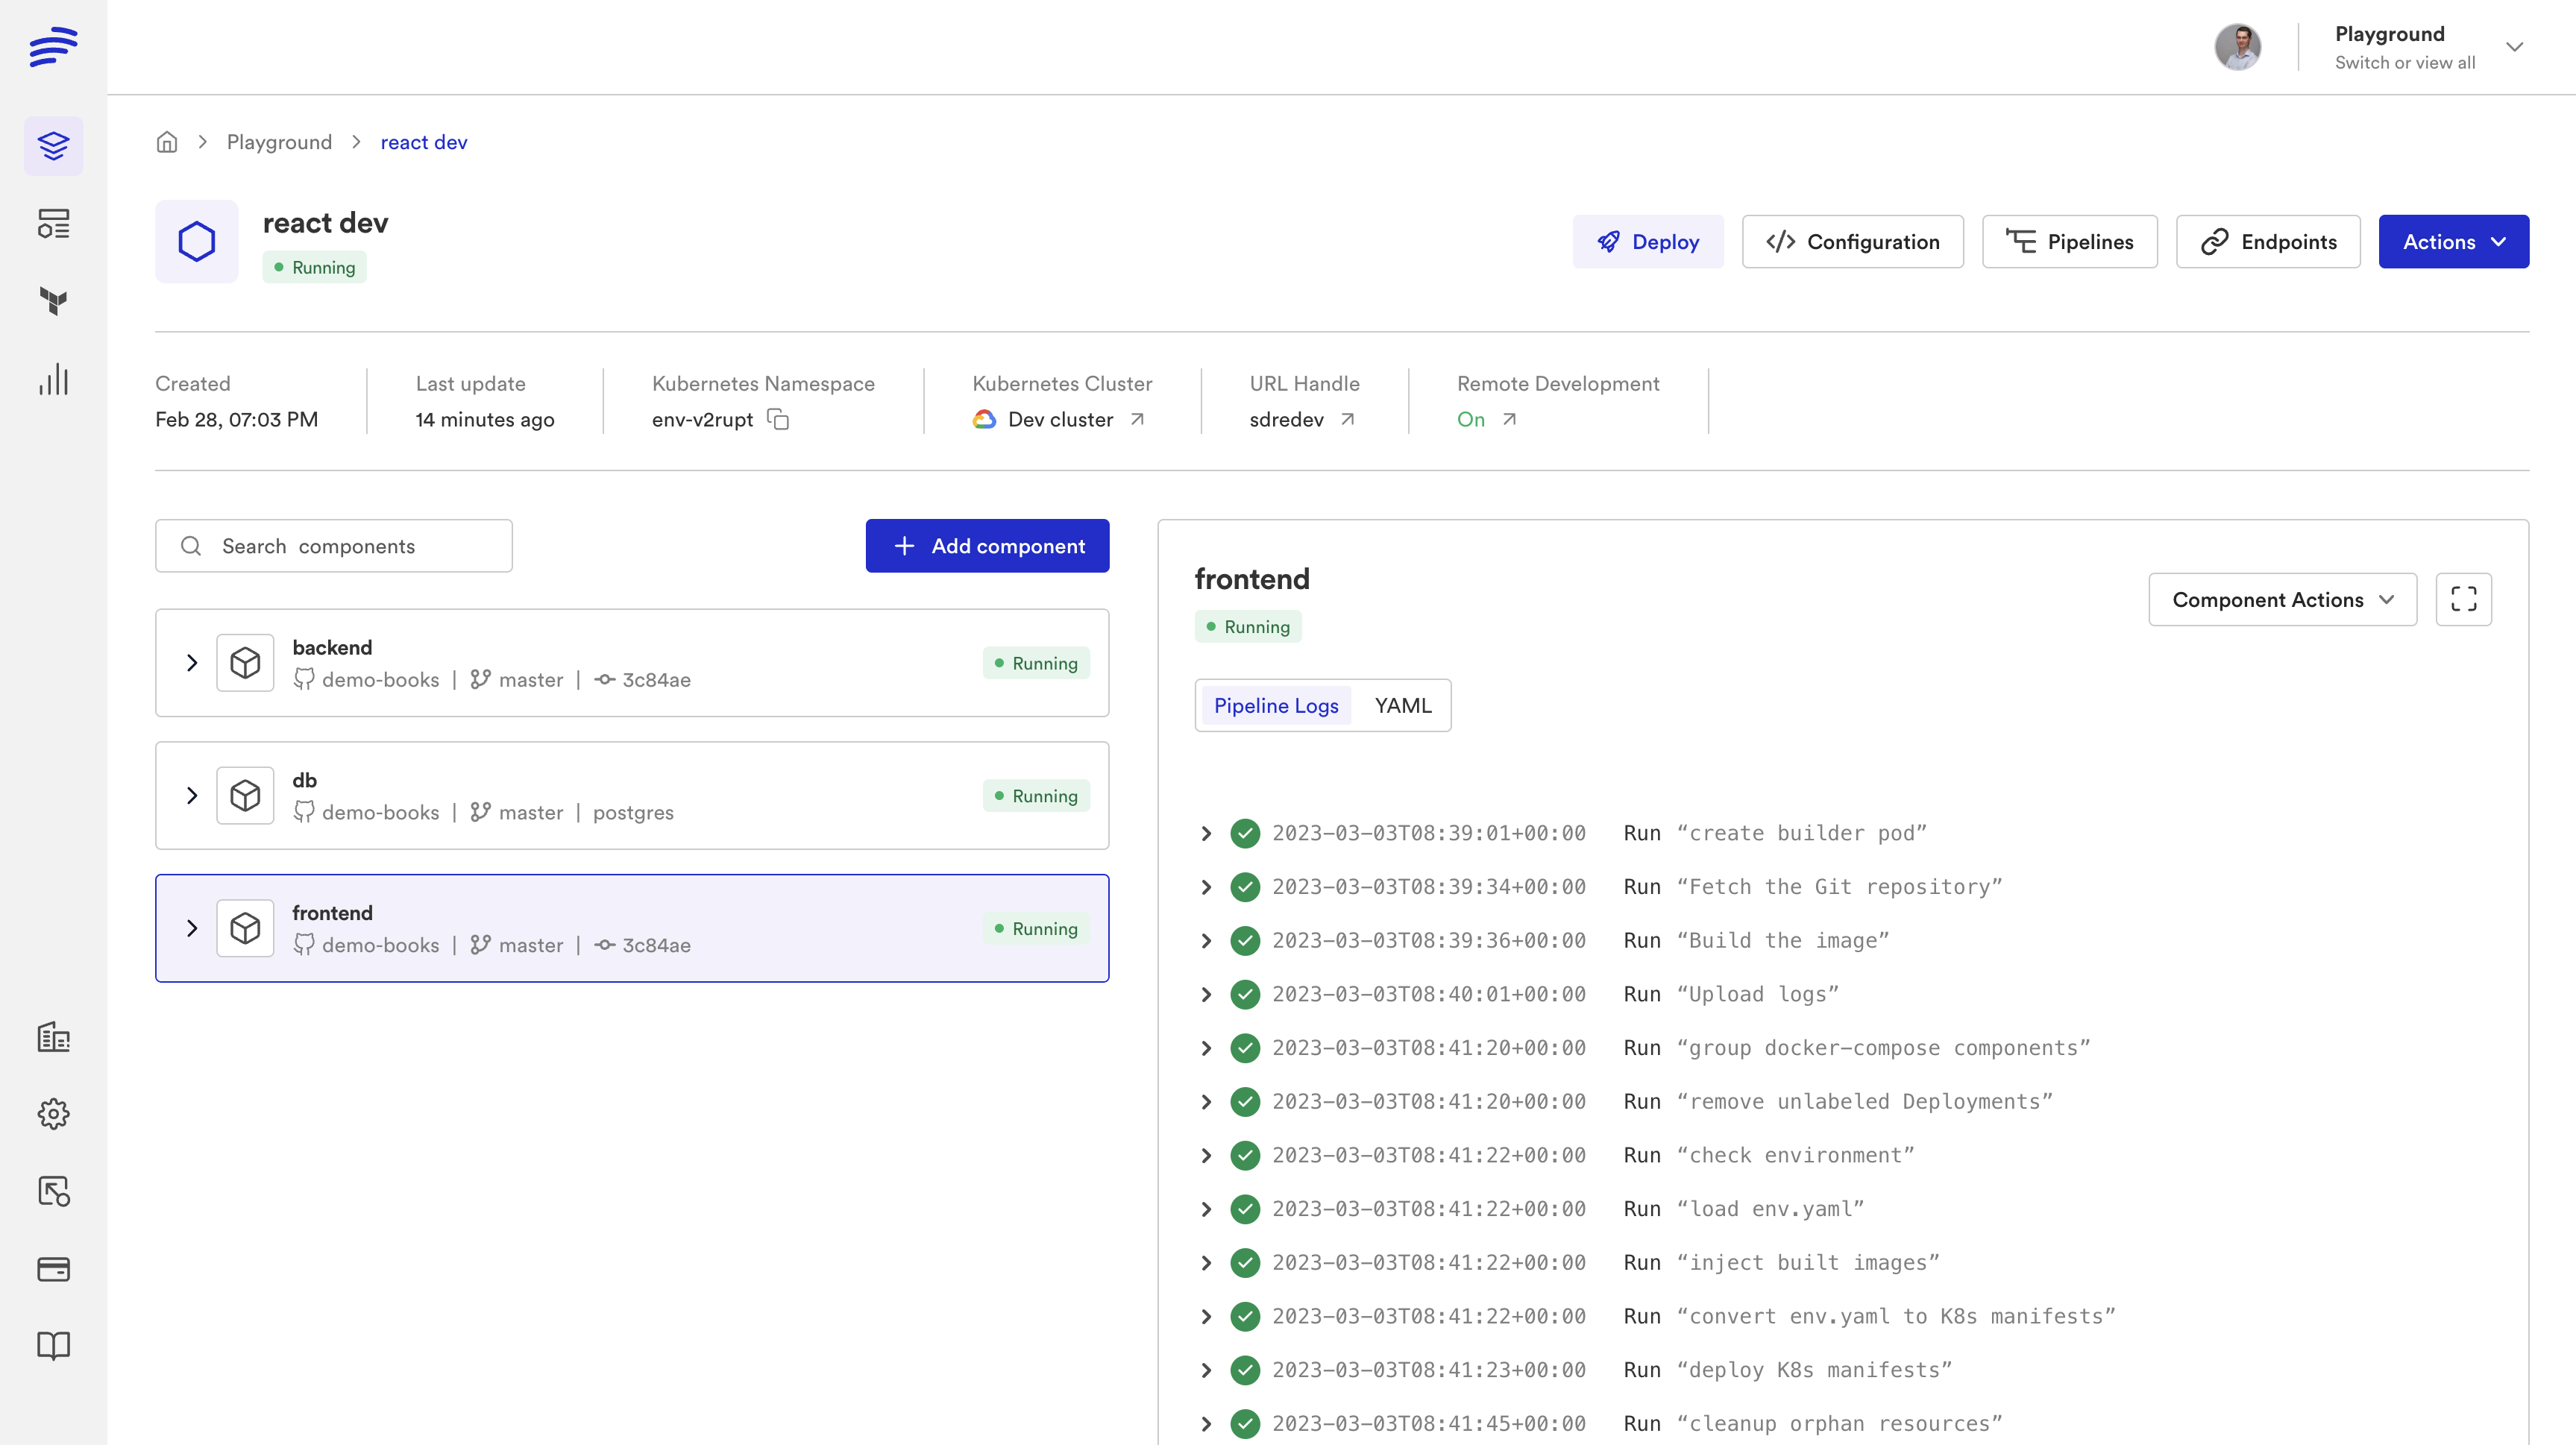
And the frontend URL is https://frontend-sdredev.bunnyenv.com/.
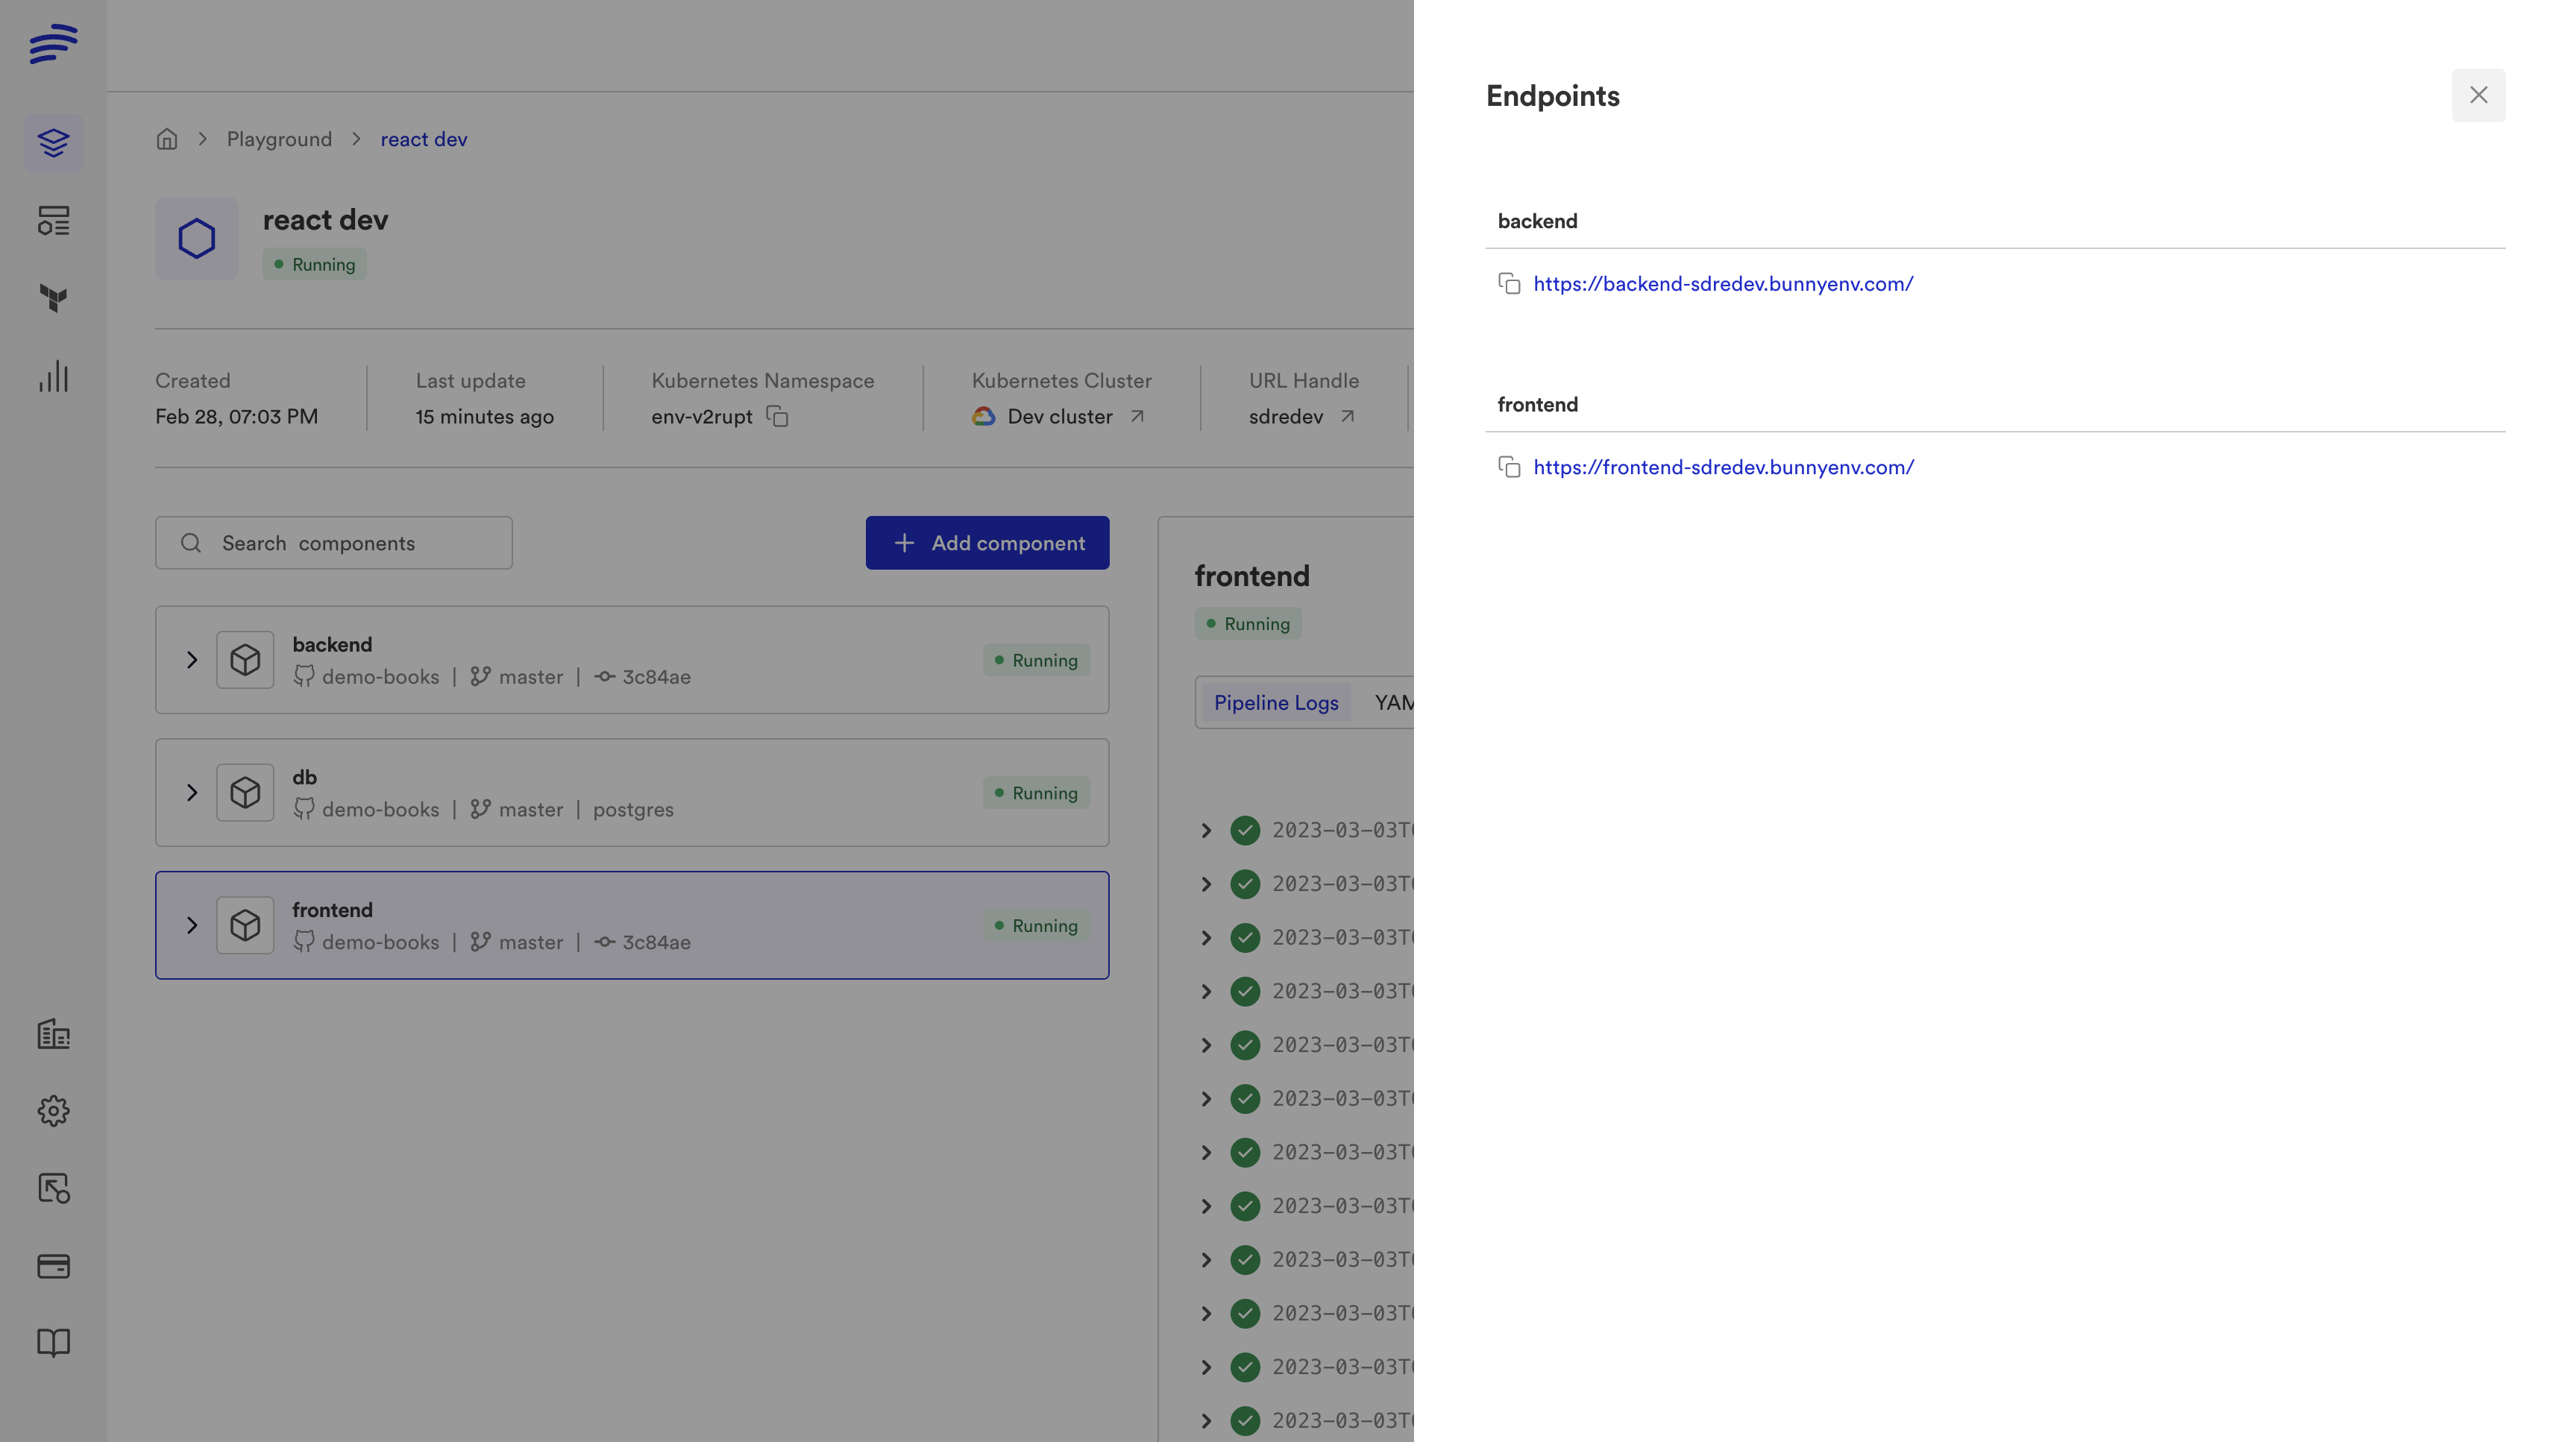
Let's take a look at how to...
Configure the IDE
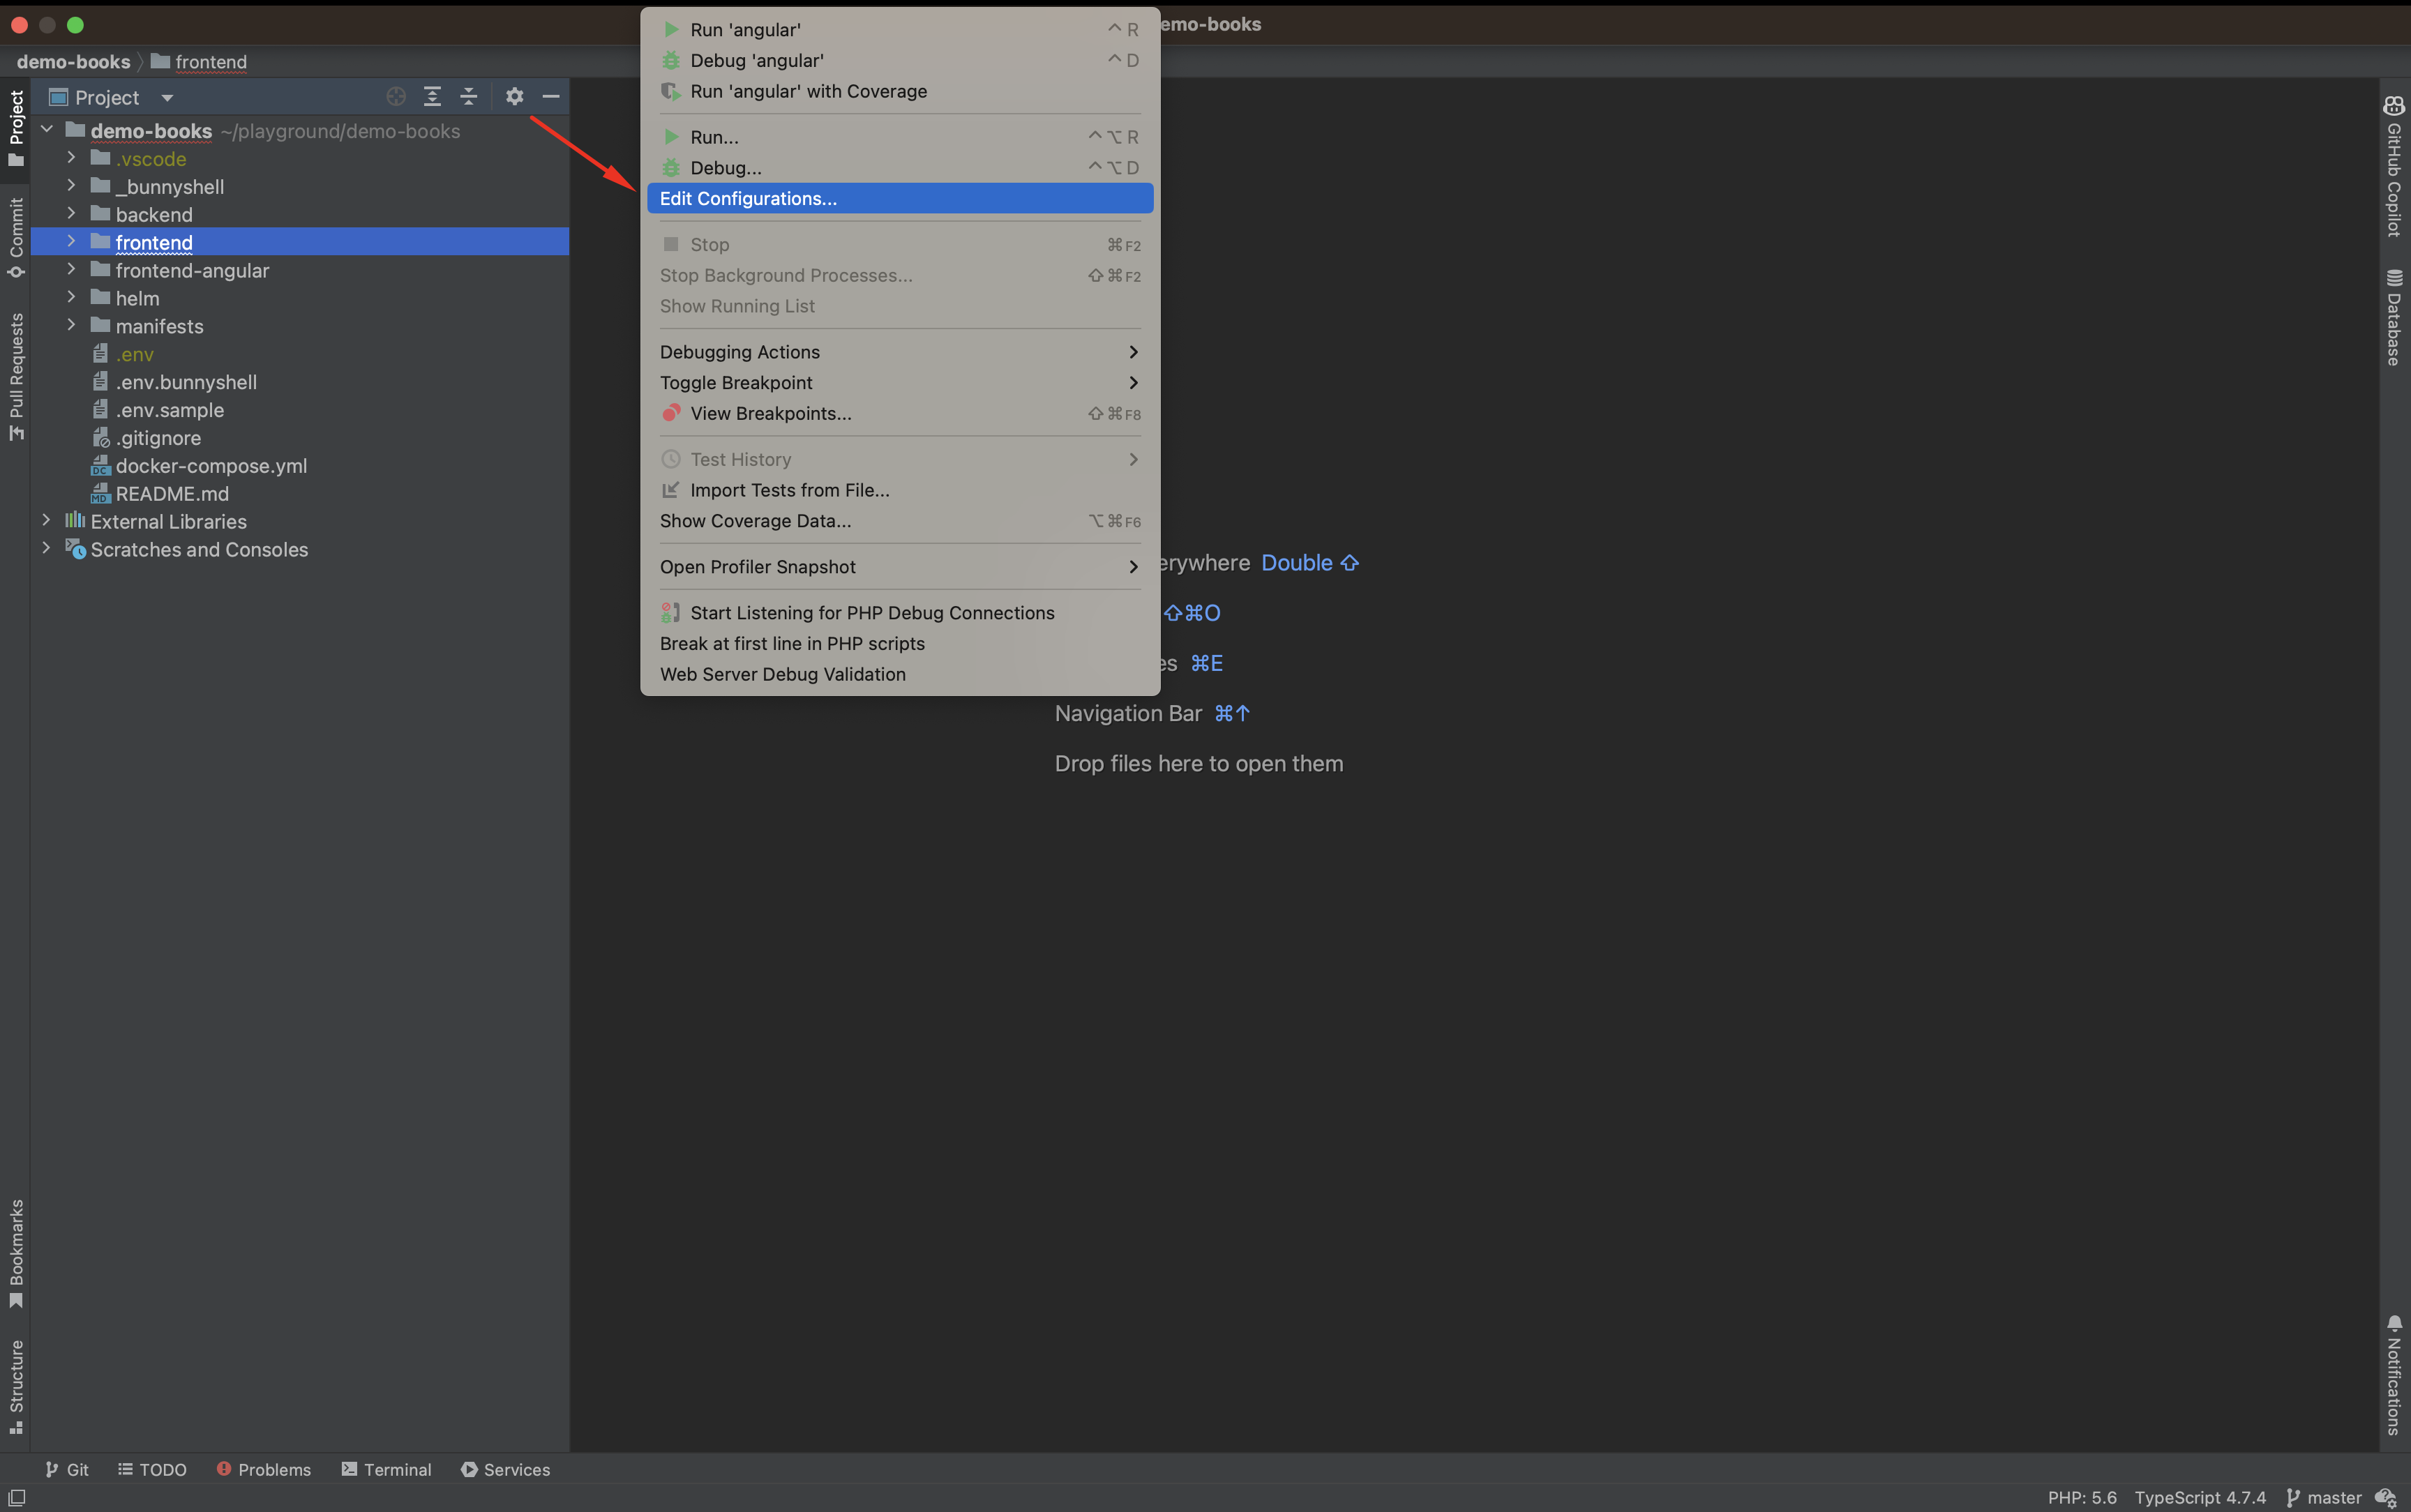
- Go to Run > Edit Configurations and then click the add button (
+sign).
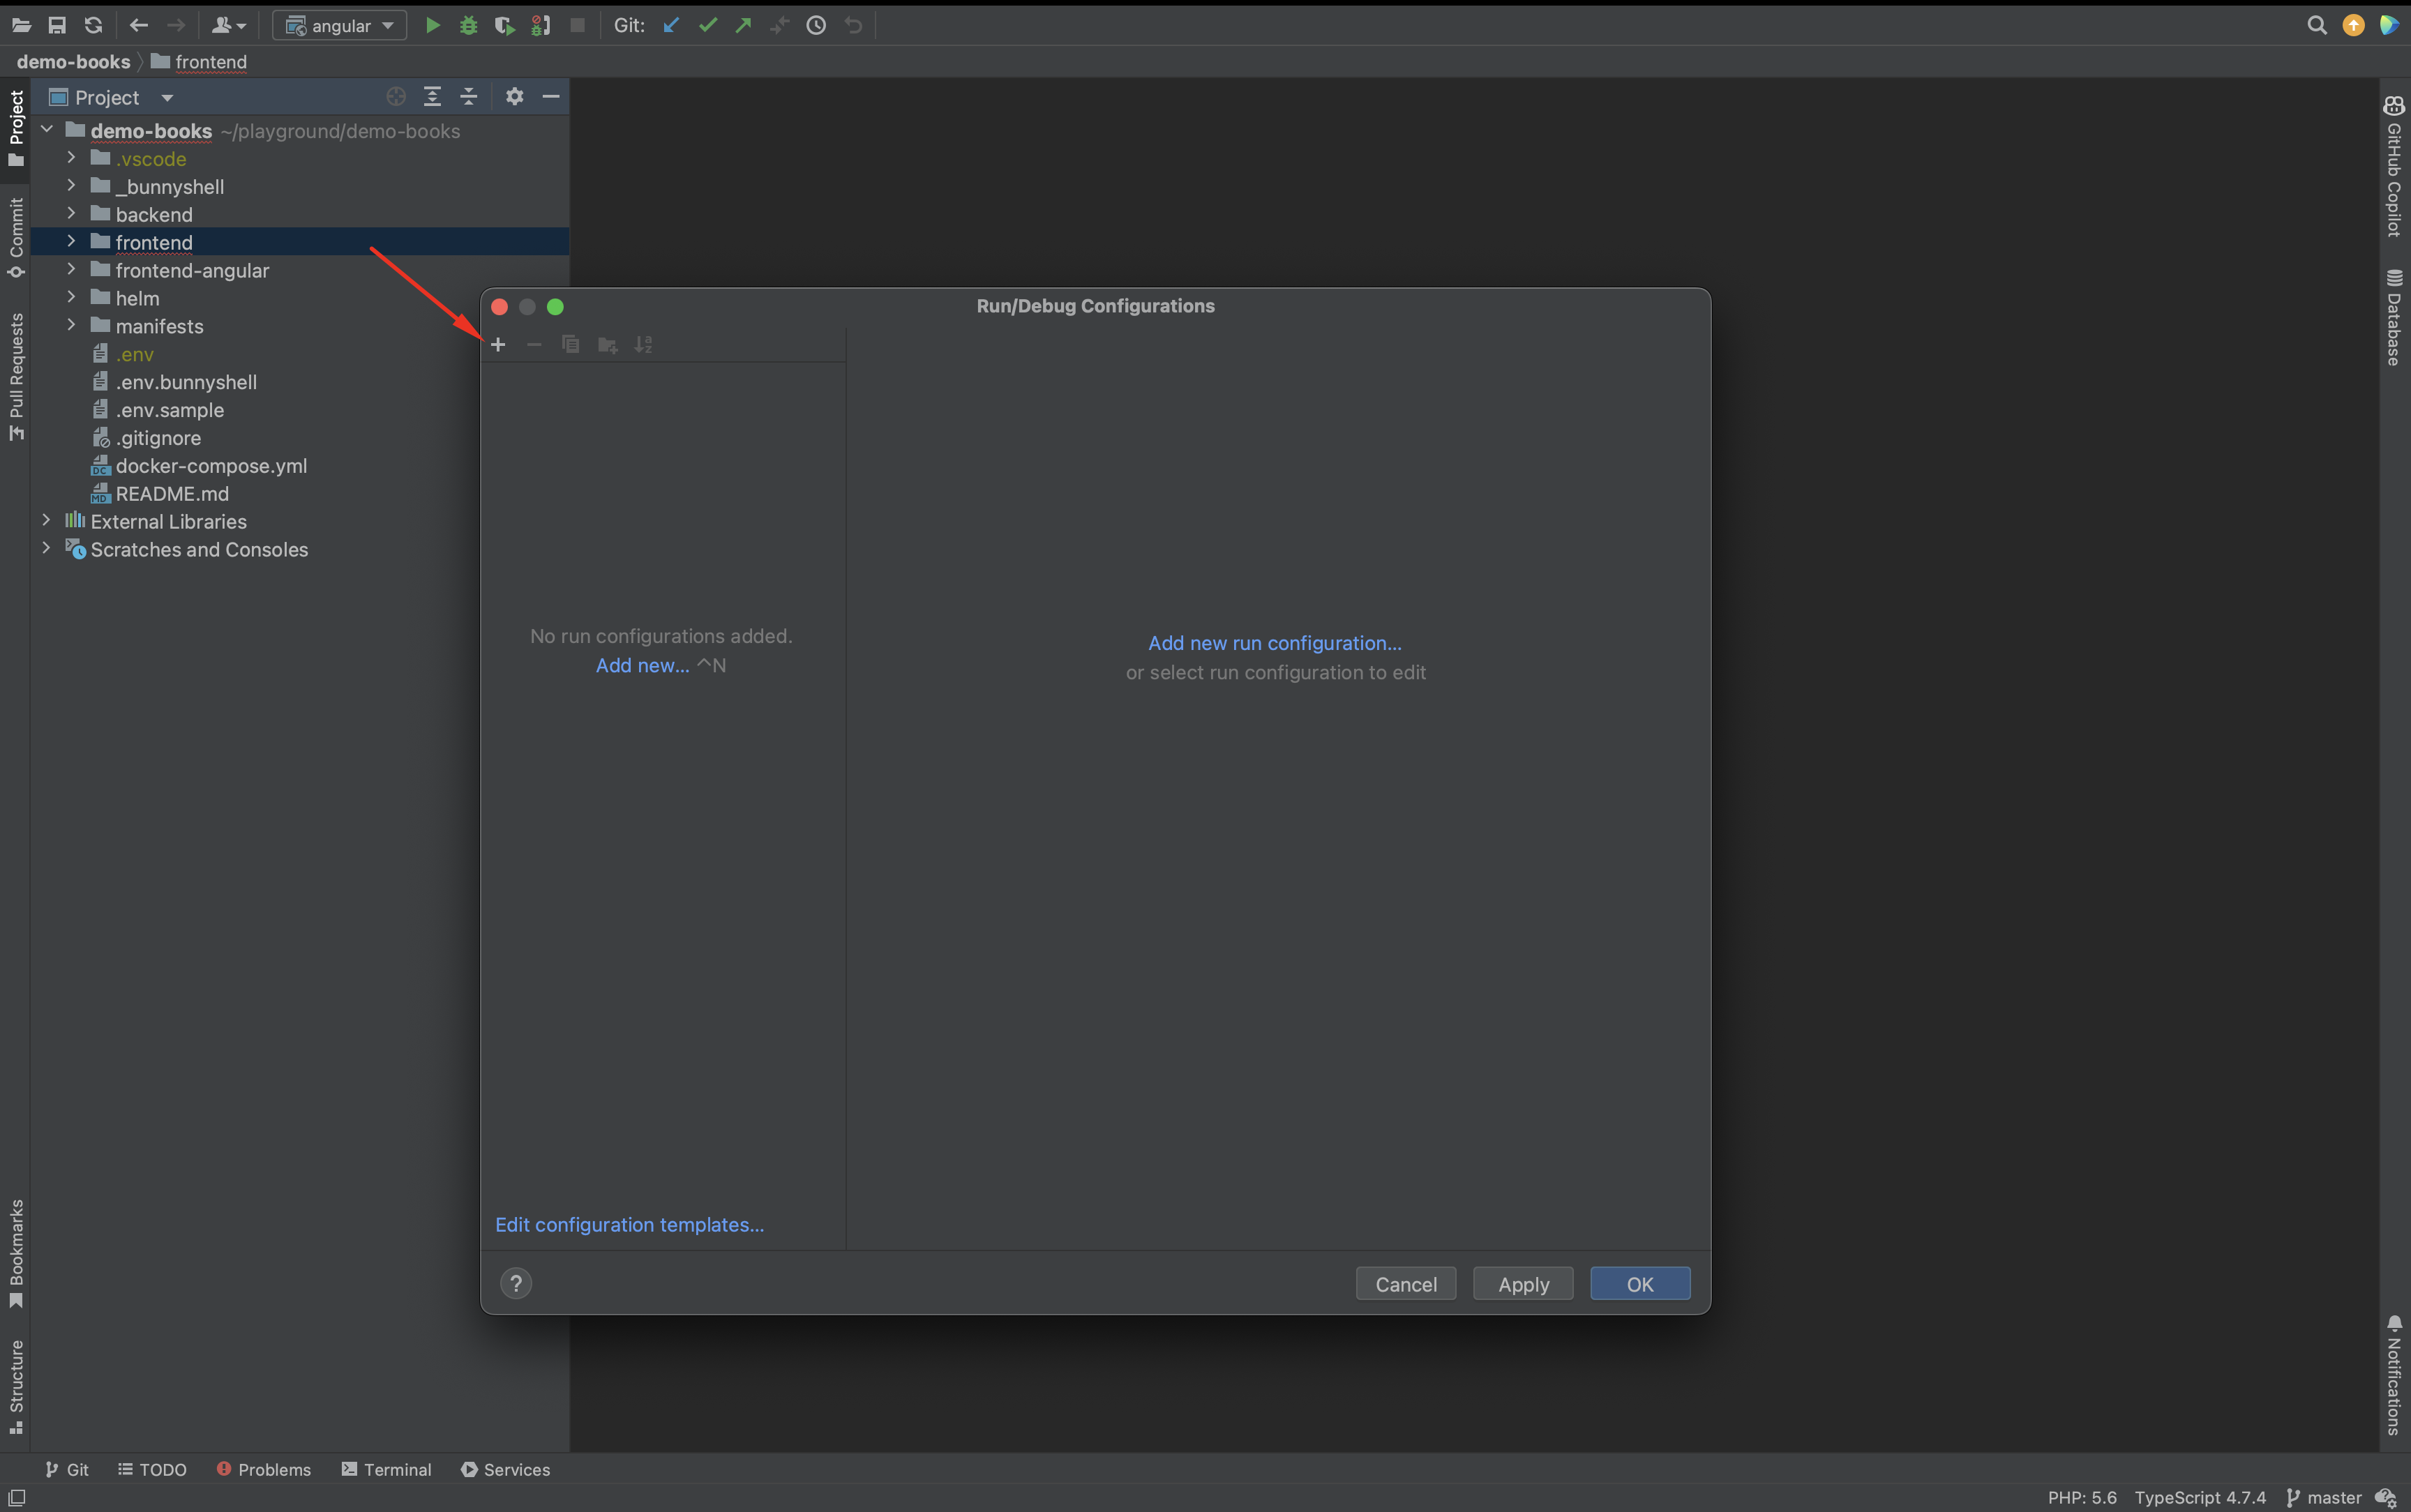
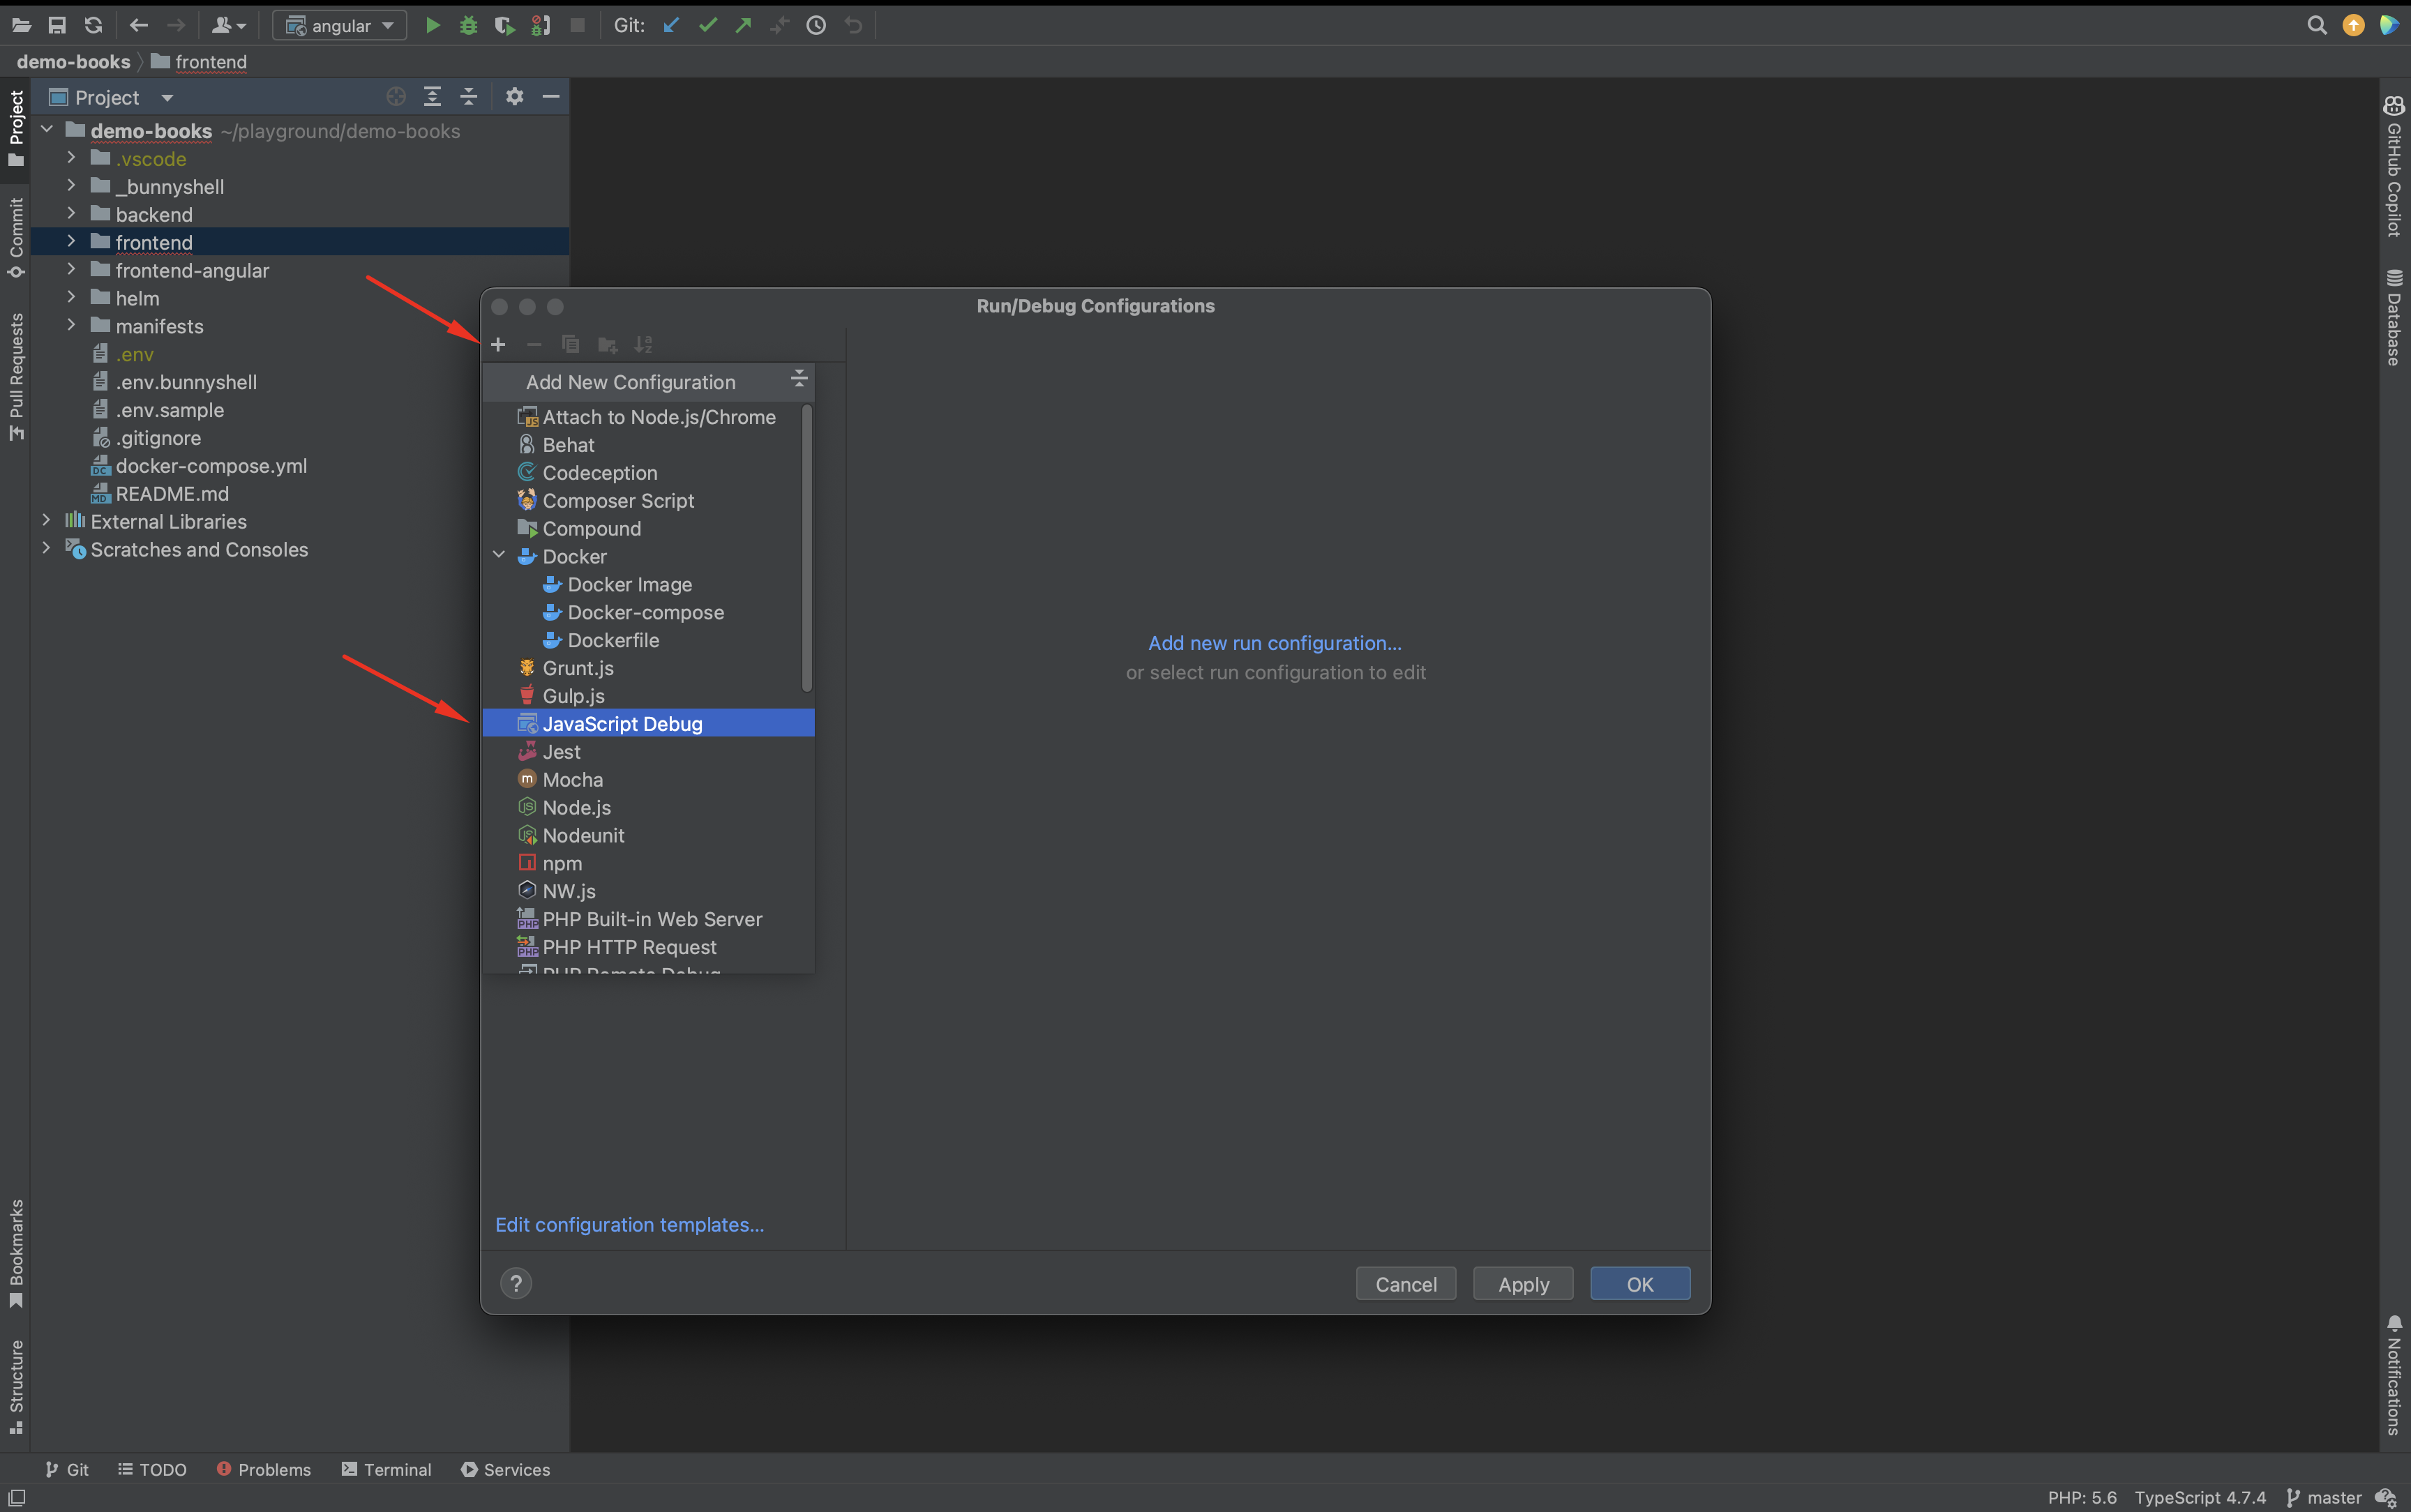
- Enter the name of your choice and the
frontendComponent's URL (https://frontend-sdredev.bunnyenv.com/in this case), then enter the URL as mapping for the local folder corresponding to your application files.
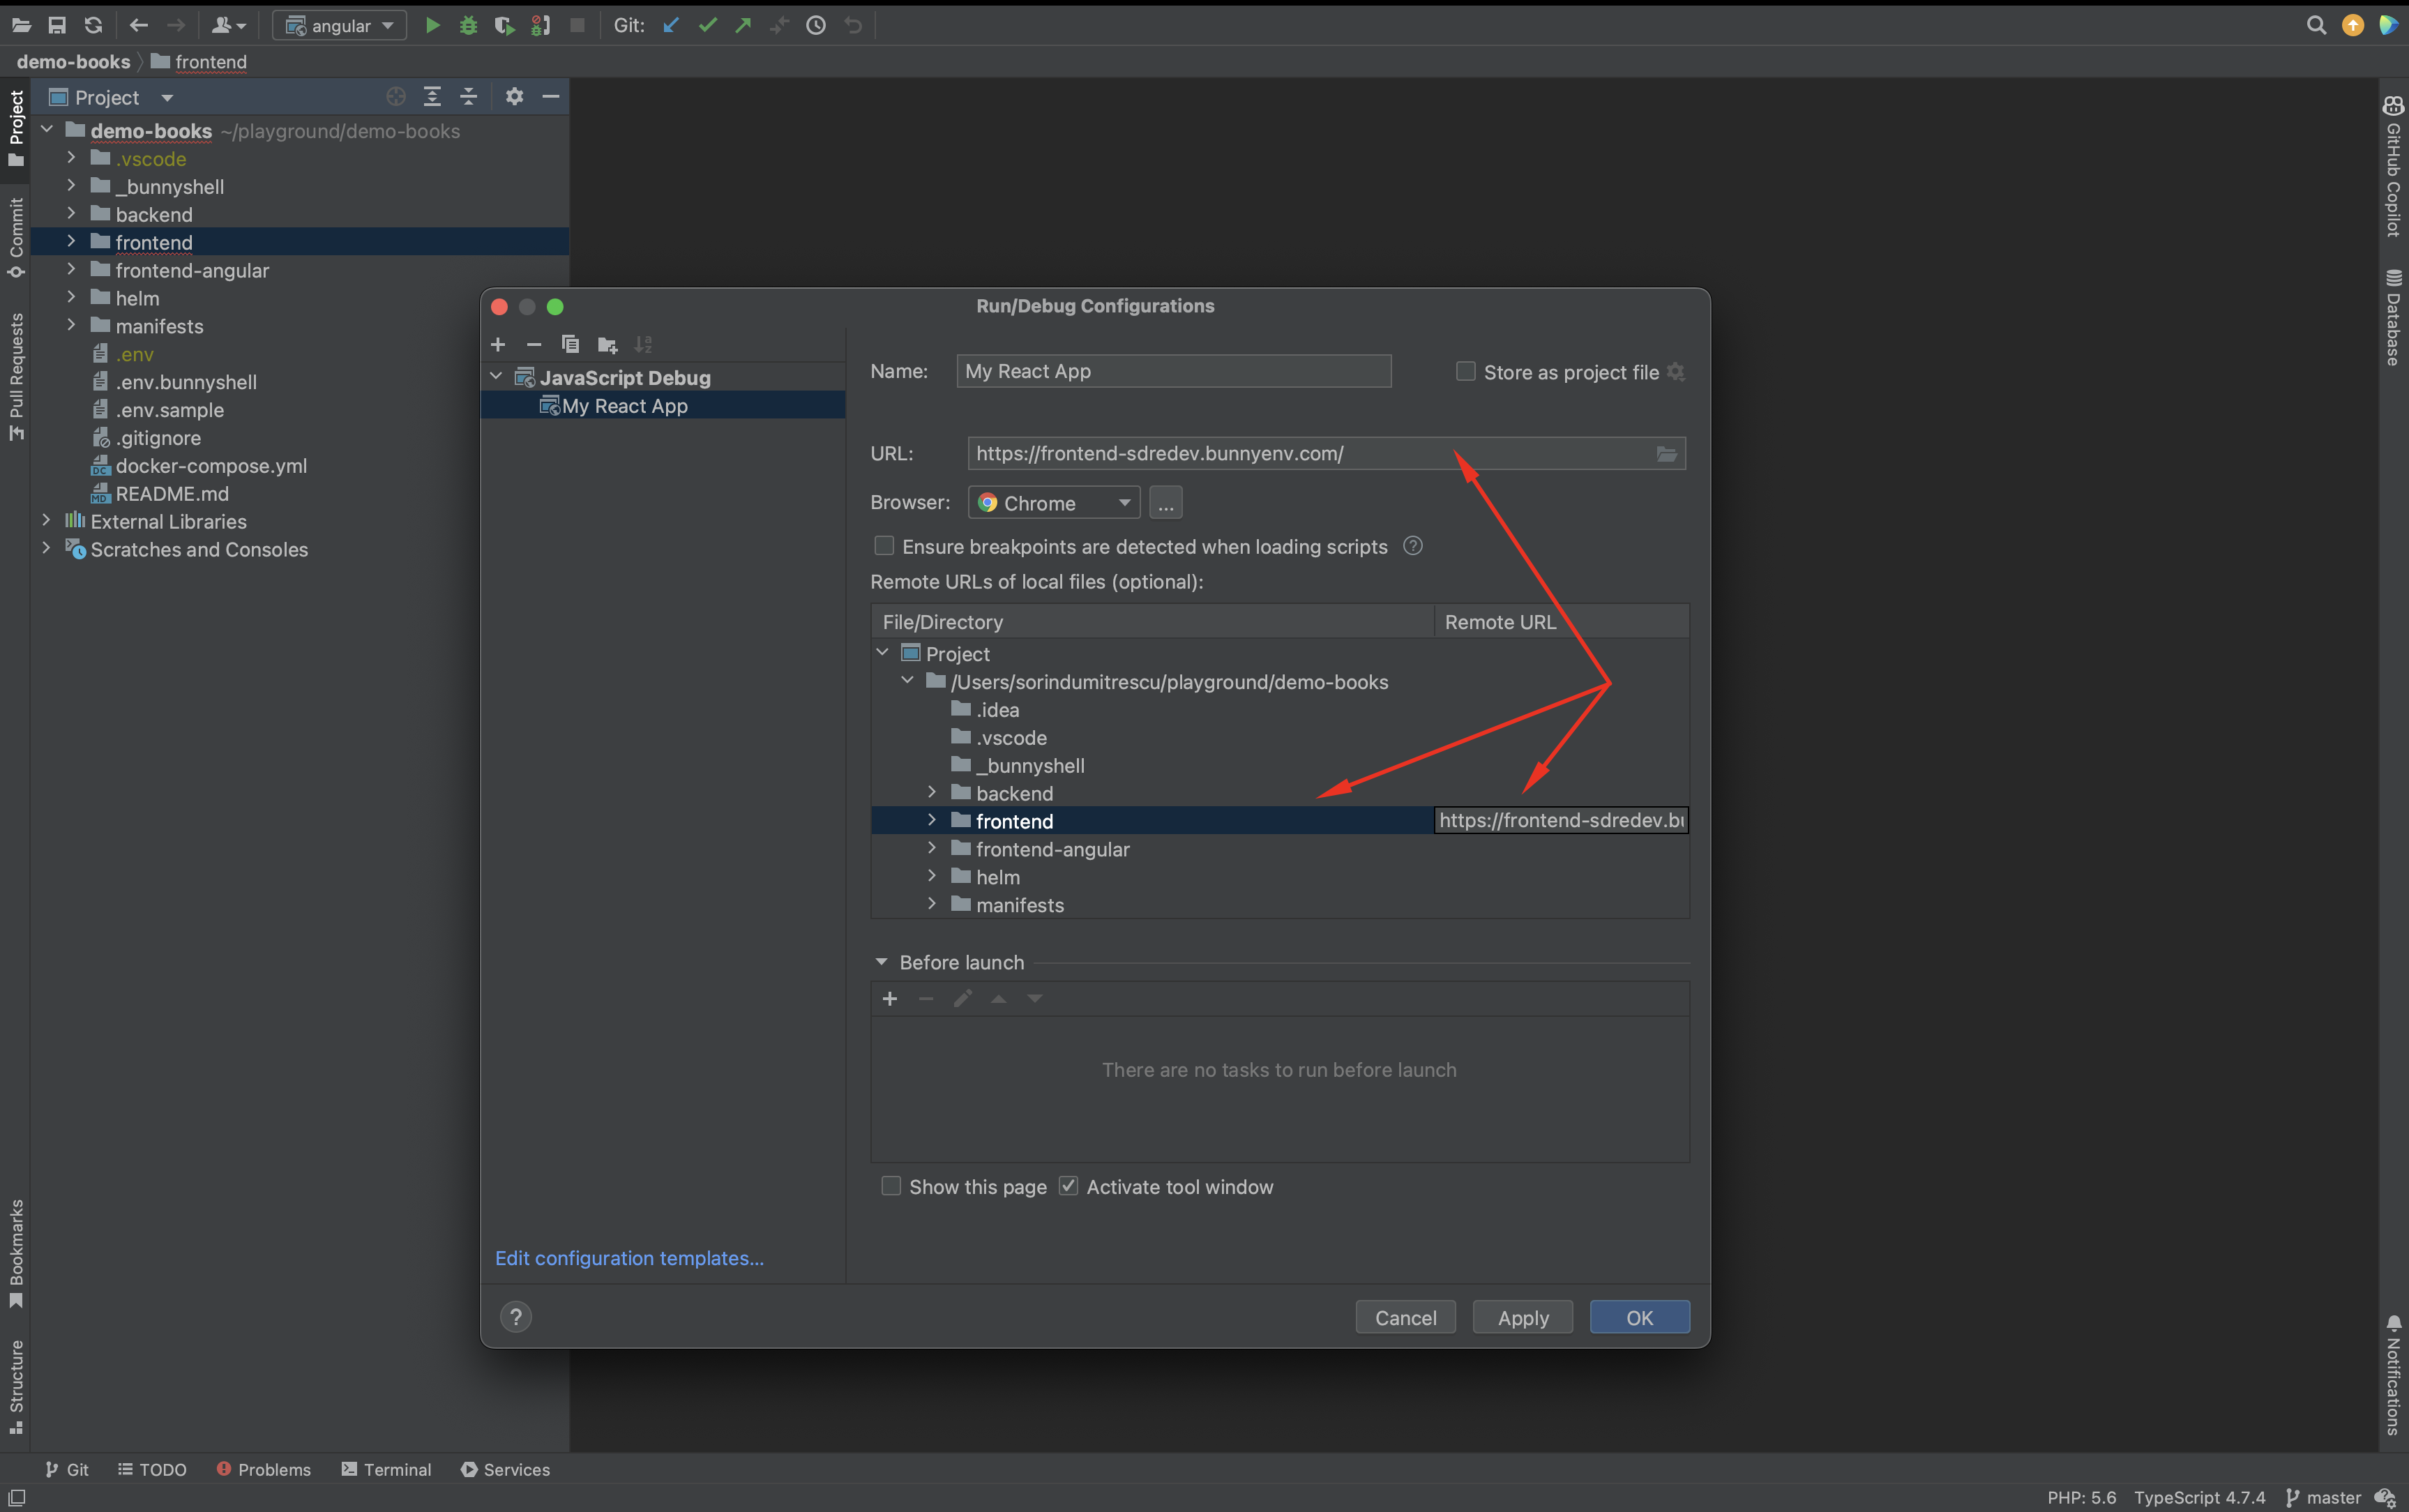
- Click OK and the configuration is set.
Debug your application
- To launch a debugging session, you only need to do is just make sure your configuration is selected in the debugging toolbar and then run "debug" configuration.
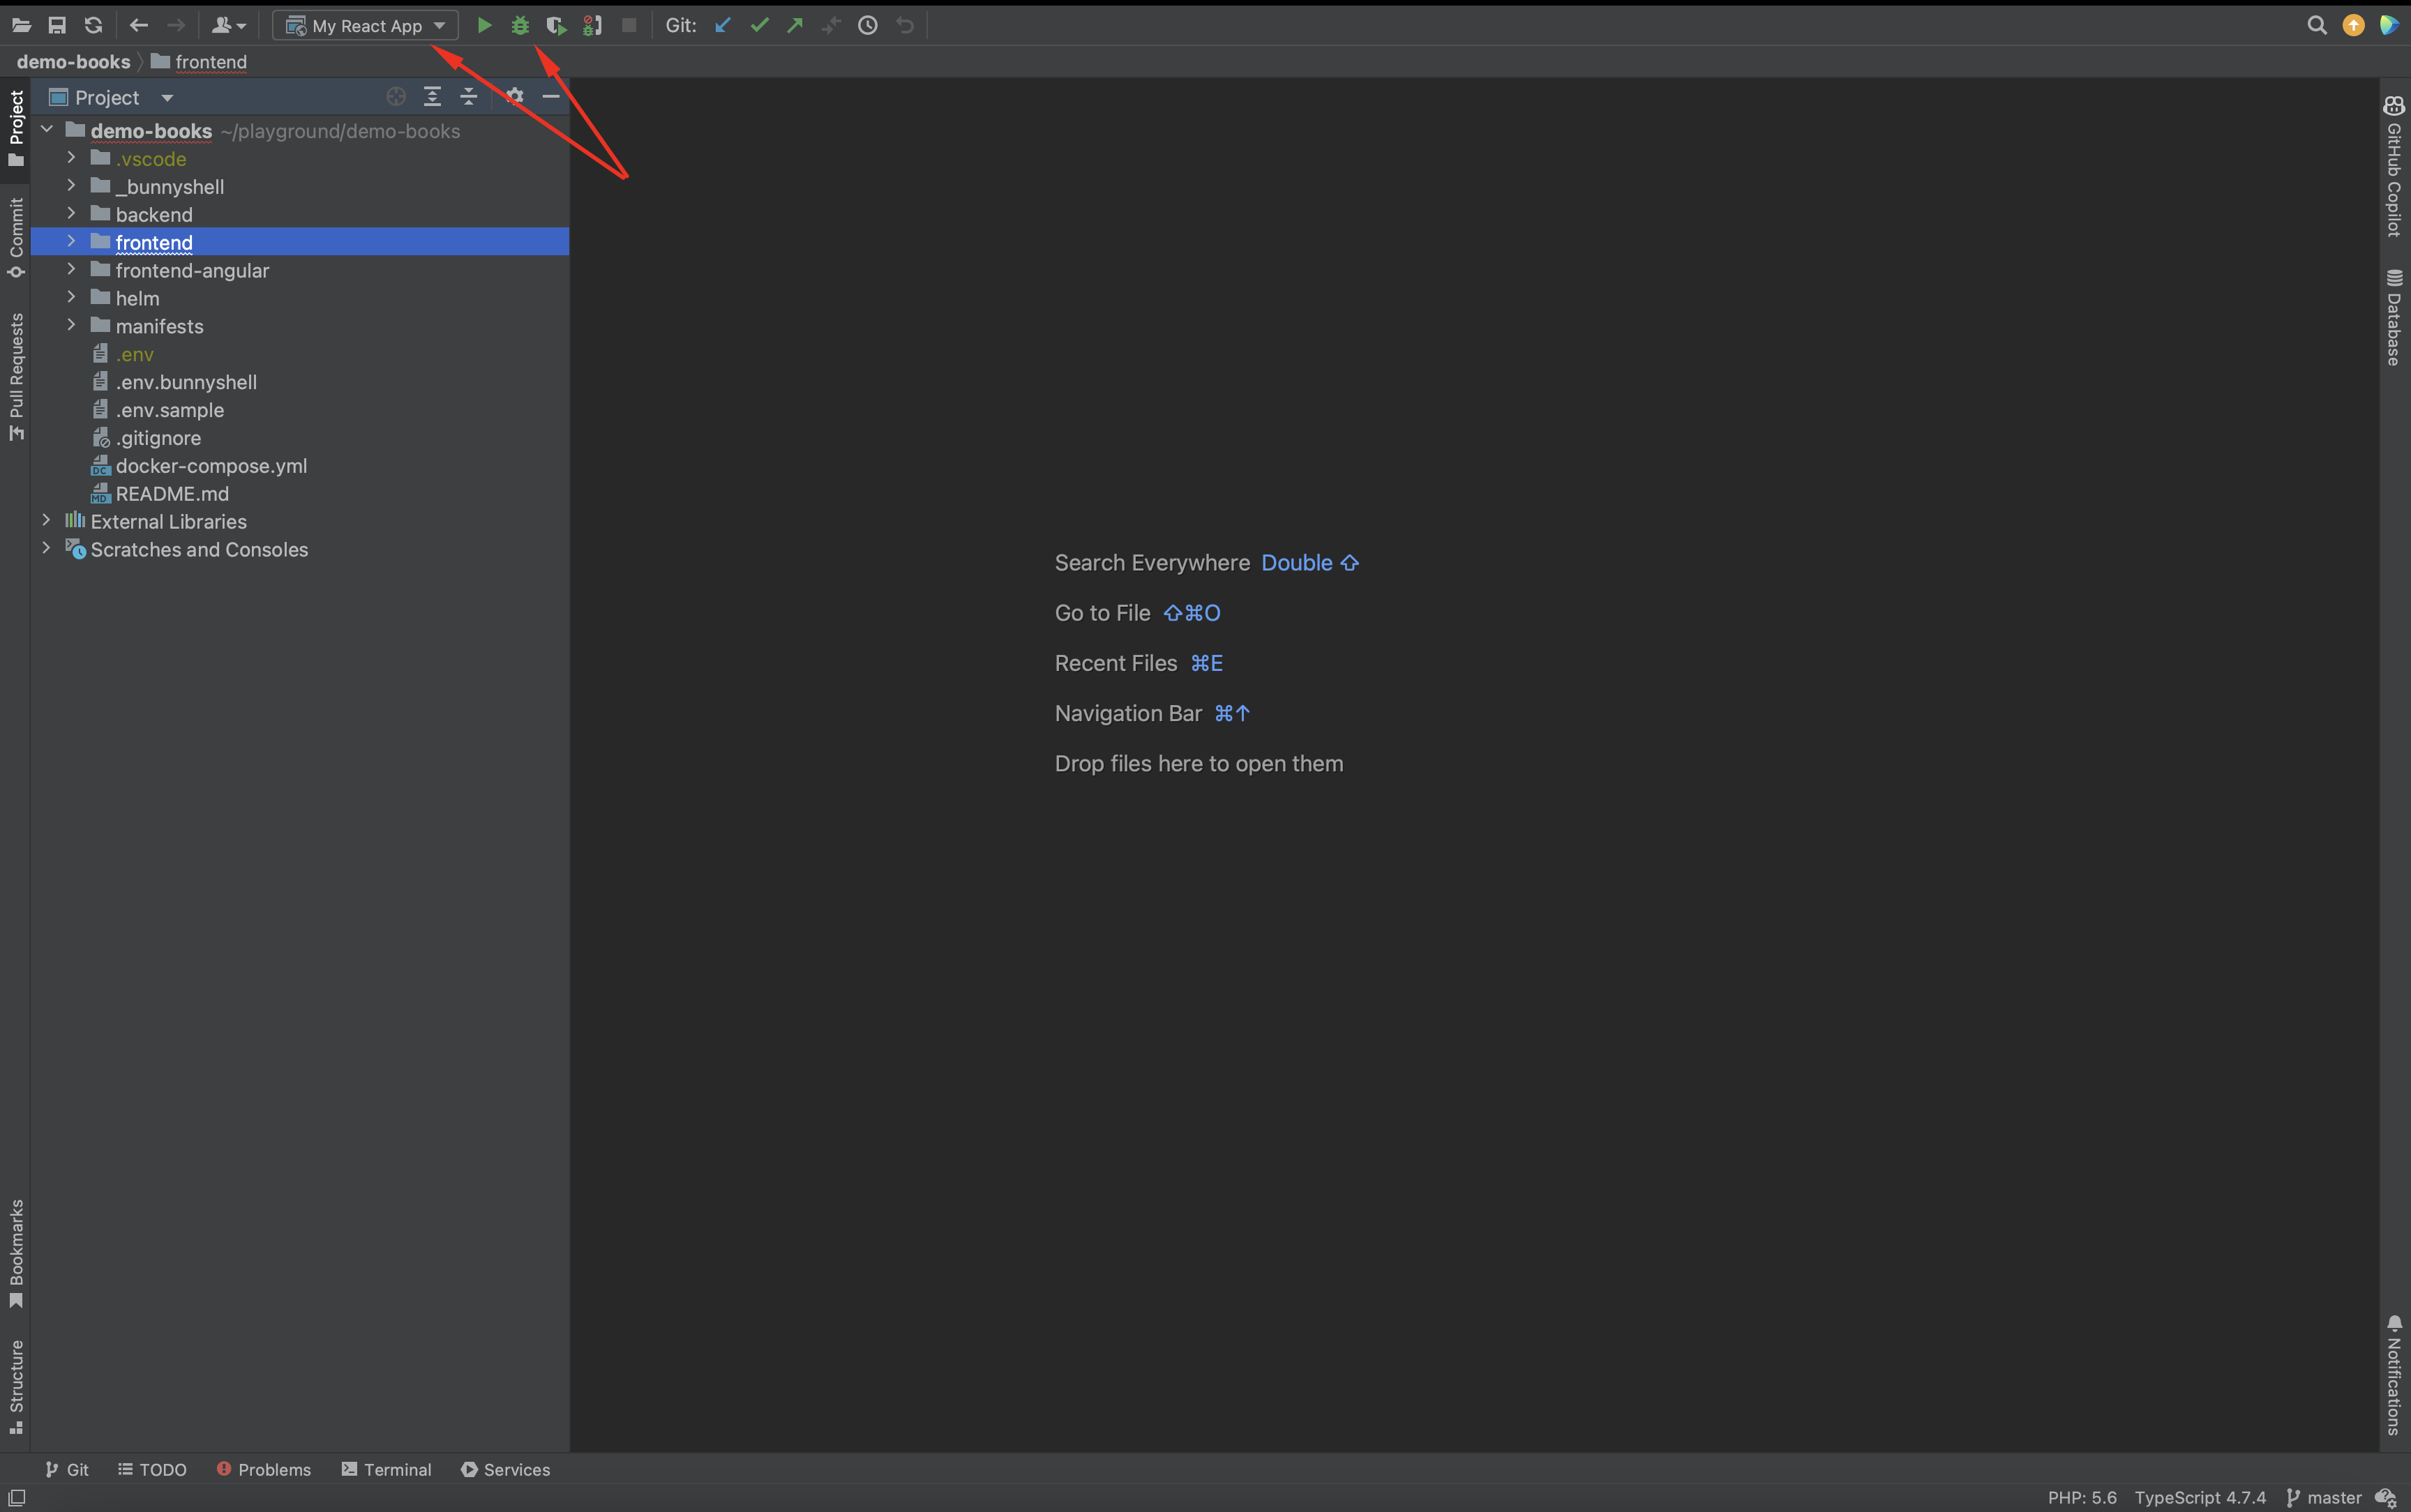
This will launch a new instance of your browser, ran with some additional arguments to allow debugging. Also, the new browser window will use a separate profile used for the session; this is a good thing, as it separates your workspace (including extensions) from it.
You can also configure Chrome to start by default in this debug mode by adjusting your IDE configuration.
Please consult the dedicated Jetbrains documentation.
This will allow you to use the same Chrome window (on the same profile) you already have open.
- Make sure you add some breakpoints and then launch the debugging session.
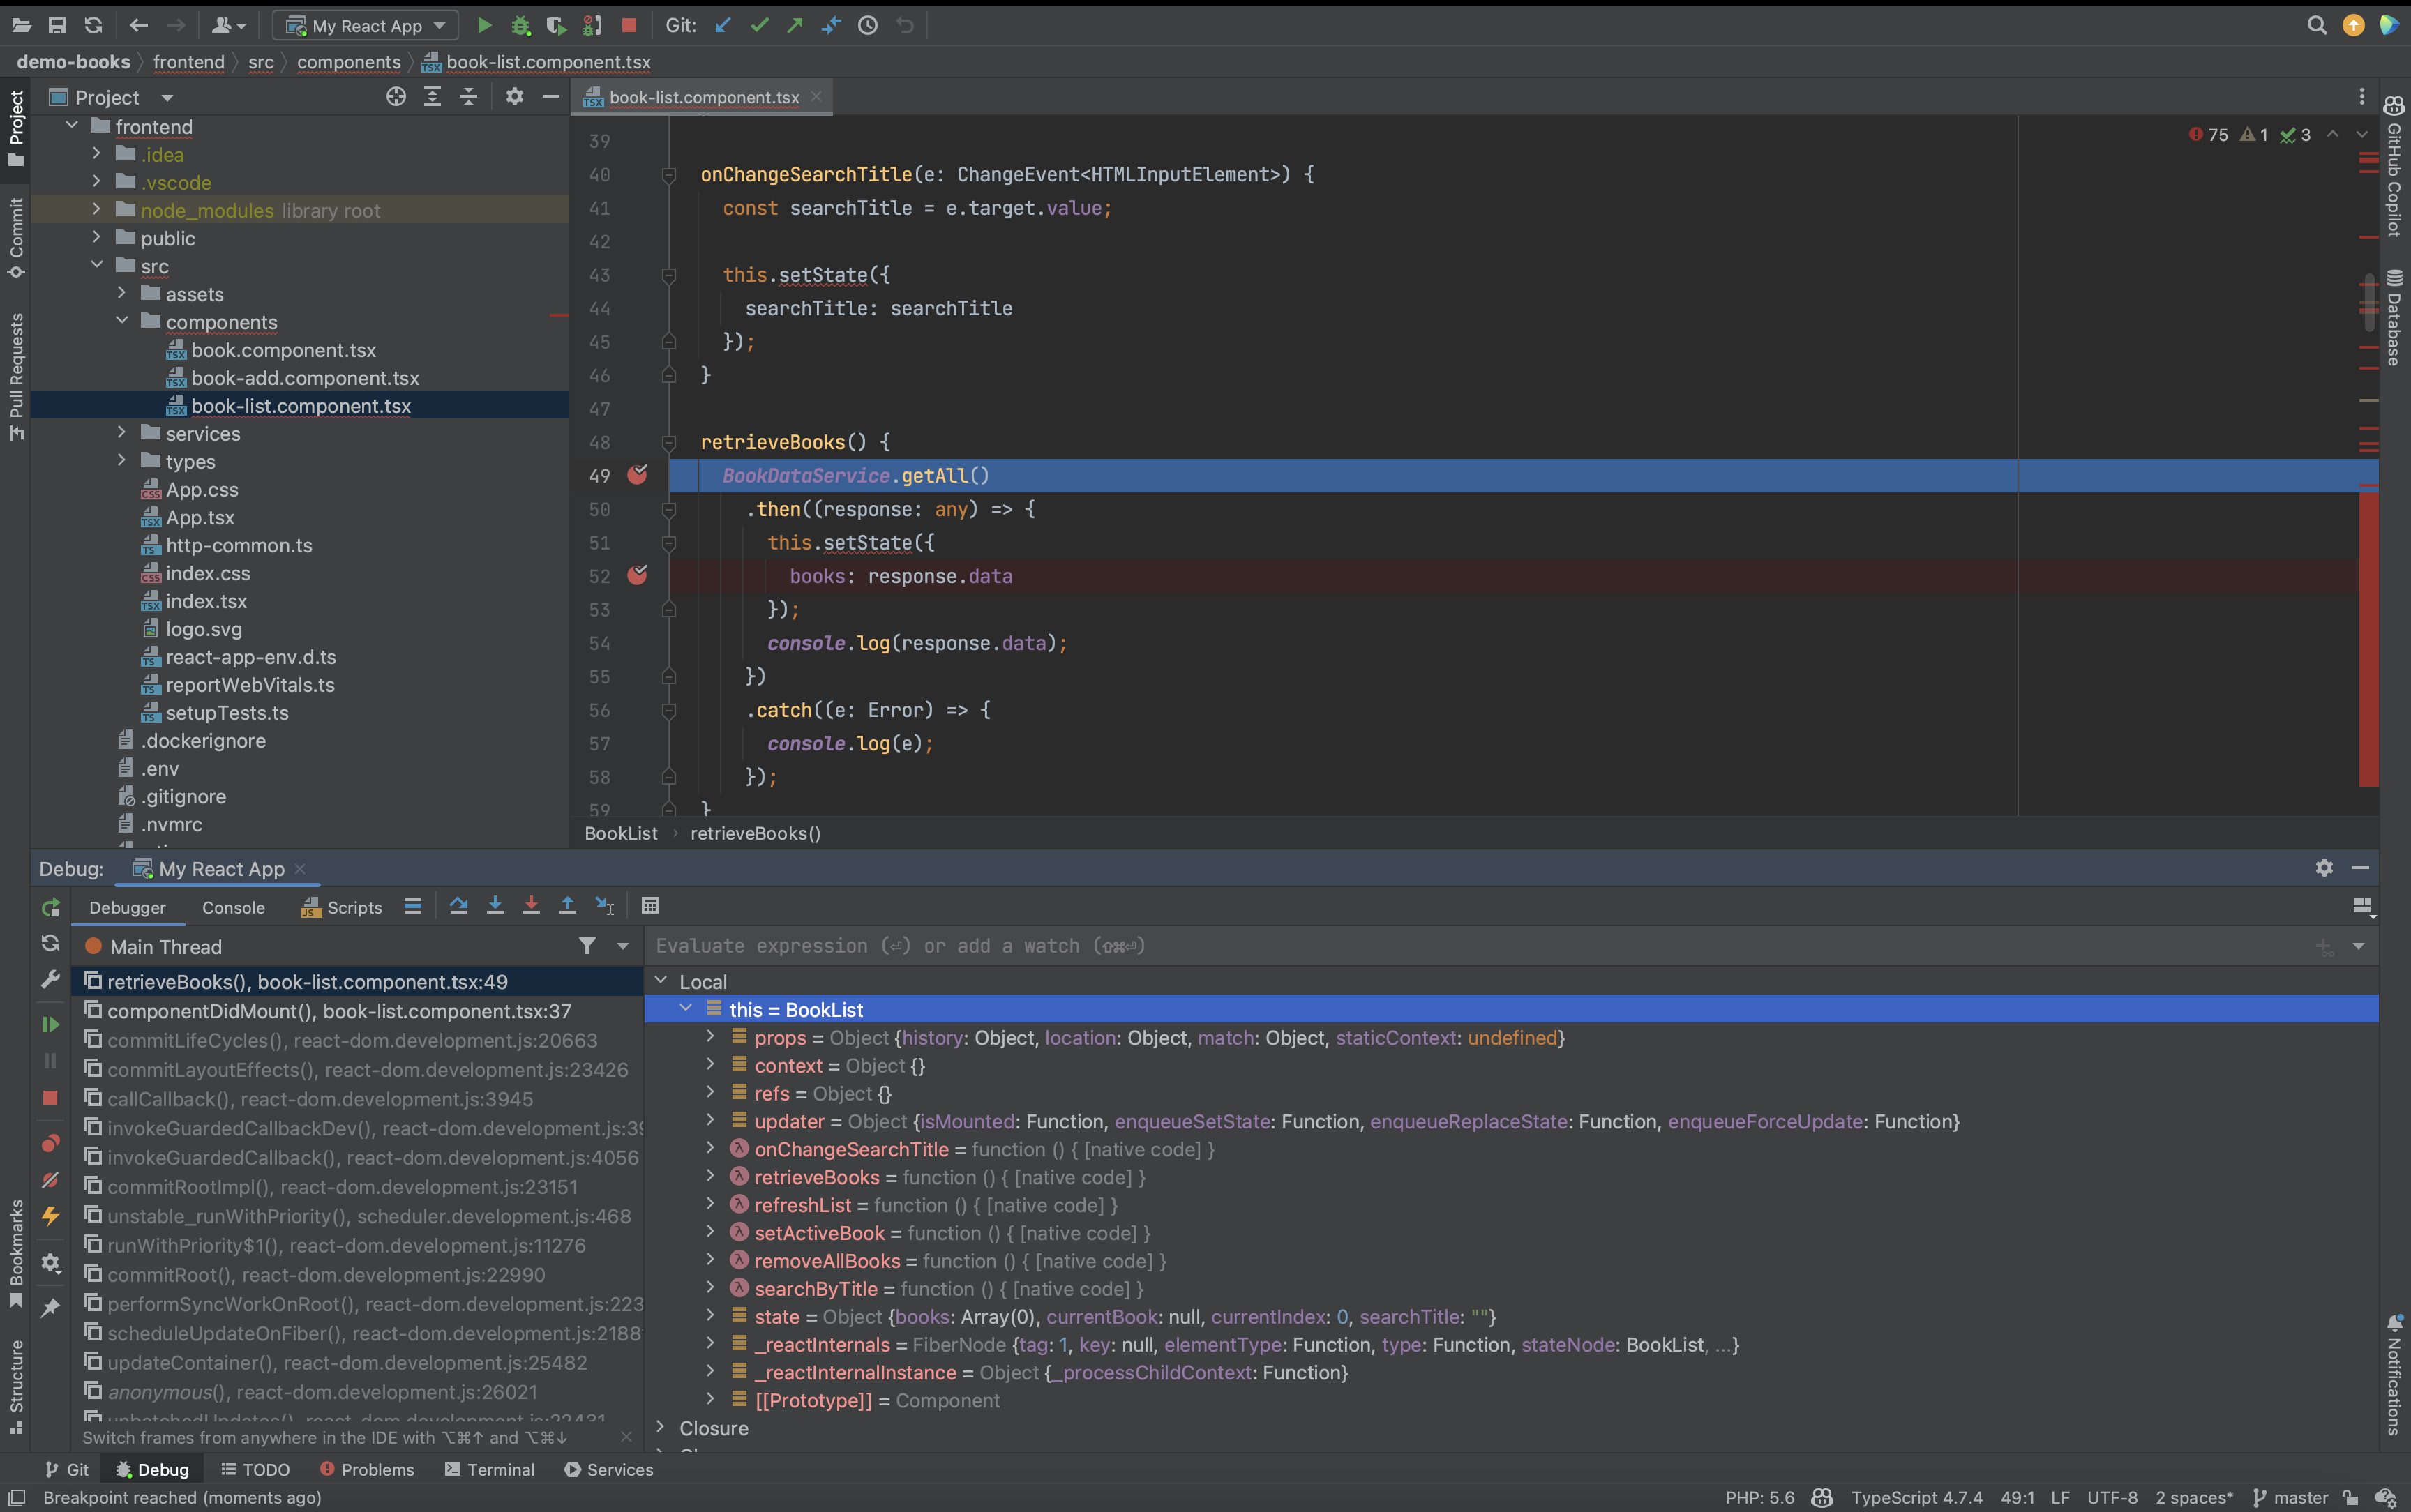
For more information, please visit the dedicated VS Code documentation:
Happy debugging!
Updated 8 months ago
